Track Spotify Monthly Listeners Over Time Like A Pro
- Nov 8, 2025
- 12 min read
Tracking your Spotify monthly listeners over time is the single most effective way to measure your music's momentum and audience reach. This isn’t just some vanity metric you check once in a while; it’s a living, breathing chart of your career's health. It shows you the real, unfiltered impact of your new releases, marketing pushes, and those rare viral moments.
Why Tracking Monthly Listeners Is Your Secret Weapon
Forget obsessing over the number you see today. The real power is in the story that number tells over weeks, months, and even years. Monthly listeners represent the unique individuals who streamed your music in the last 28 days. When you start looking at this data historically, it transforms from a simple count into a powerful diagnostic tool for your career.
This is your direct line to understanding what’s actually working. Did that collaboration cause a sustained lift in your baseline audience? Did a TikTok trend create a massive, sharp spike that then tapered off? Without tracking the trend, these critical cause-and-effect relationships are totally invisible.
Pinpoint Growth and Prove Your Value
A steady upward trend is more than just encouraging—it's hard proof of your growing influence. This historical data becomes your leverage when you're pitching to playlist curators, booking agents, or potential labels. It shows consistent growth and an engaged fanbase, which is way more compelling than a single, static number.
For instance, the Spotify for Artists dashboard gives you a snapshot of your current audience engagement.
This dashboard provides the essential, at-a-glance metrics that become the building blocks for your long-term analysis. Think of it as your starting point.
Tapping Into a Growing Global Audience
Understanding your listener trends is especially crucial given the platform's sheer scale. Spotify's global reach is massive, hitting 602 million monthly active users by the end of 2023 and climbing to around 675 million in early 2024.
This ever-expanding pool of listeners presents a huge opportunity for any artist who knows how to read their own data to find new fans. You can learn more about Spotify's user growth statistics on SearchLogistics.com.
The goal isn’t just to see your listener count go up. It’s to understand why it moves, so you can replicate your successes and build a sustainable career. Every peak and valley in your listener graph is a lesson waiting to be learned.
Ultimately, monitoring your Spotify monthly listeners over time moves you from being a passive artist to an active strategist. It equips you to make smarter, data-informed decisions that fuel real, long-term fan development.
Choosing Your Listener Data Toolkit
If you're serious about tracking your Spotify monthly listeners over time, you'll need the right gear. Your choice really boils down to your goals, your budget, and just how deep you want to go with the data. Let’s walk through the main options, from Spotify’s own backyard to some seriously powerful third-party services.
Your first stop is always going to be Spotify for Artists. It’s free, it’s essential, and it’s your direct line to how your audience is behaving. Inside, you can see your monthly listeners, streams, and followers, with graphs showing trends from the last 28 days all the way back to 2017. This is perfect for a quick, daily health check on your music.
But let's be real, its historical view can feel a bit constrained. Sure, it shows an all-time graph, but good luck trying to pinpoint exactly what marketing push from two years ago caused a specific spike. For that kind of day-by-day historical deep dive, you'll have to look beyond Spotify's native tools.
Going Beyond the Basics with Third-Party Platforms
This is where dedicated music analytics platforms really shine. Tools like Chartmetric and Soundcharts are built from the ground up for the kind of in-depth, long-term analysis artists and their teams need. They archive data daily, letting you zoom in on any period with surgical precision and even stack your growth against other artists.
These platforms are designed to fill the gaps left by the native dashboard. They offer features like:
Long-Term Historical Data: Pull up an artist's entire listener history, day by day, for years.
Competitive Analysis: See how you stack up against similar artists and benchmark your own progress.
Playlist Monitoring: Instantly see which playlists are driving your listener growth and when you were added or removed.
Here's a taste of the kind of detailed overview you can get from a platform like Chartmetric.
This kind of dashboard gives you a much wider lens, pulling together key performance metrics from across an artist's entire digital footprint, not just Spotify.
Now, these tools are incredibly powerful, but they usually come with a monthly subscription. They're best for dedicated independent artists, managers, and labels who rely on comprehensive data to build their strategies. The investment often pays for itself by giving you the insights needed to make smarter moves.
The real difference is perspective. Spotify for Artists tells you what happened. Third-party tools help you understand why it happened and how you compare to everyone else.
Specialized Tools for Granular Tracking
For artists who just want a focused solution without all the bells and whistles, other platforms offer more specific functions. Some services are built to monitor just a few key metrics with extreme precision.
If your main goal is simply to archive your own numbers automatically, a dedicated Spotify monthly listeners tracker can log your key stats daily. This gives you a clean, long-term record of your growth without the complexity (or cost) of a full-blown analytics suite.
To give you a clearer picture, here’s a quick breakdown of the main tools available for tracking your Spotify listener data.
Comparison of Spotify Data Tracking Tools
Tool | Key Feature for Historical Data | Ideal User | Pricing Model |
|---|---|---|---|
Spotify for Artists | Free, built-in graph showing listener trends since 2017. | All artists, especially for daily check-ins. | Free |
Chartmetric/Soundcharts | Daily archived data, competitive analysis, playlist tracking. | Artist managers, labels, data-driven artists. | Subscription |
artist.tools | Automated daily tracking of specific metrics like monthly listeners. | DIY artists focused on specific growth metrics. | Freemium/Subscription |
Manual Spreadsheet | Complete control and customization of data entry. | Budget-conscious artists who are highly organized. | Free |
Ultimately, the best approach is often a hybrid one.
Use Spotify for Artists for your daily check-ins and official stats. Then, layer in a third-party service—or even your own meticulously kept spreadsheet—to build that rich historical context. This combined approach gives you both the raw data and the powerful analytical framework you need to see the big picture of your career's journey.
Building Your Own Listener Tracking System
You don't need some fancy, expensive software to start keeping tabs on your Spotify monthly listeners over time. Honestly, one of the most effective methods I've seen is completely free and takes just a few minutes to get going: a simple spreadsheet.
This DIY approach gives you total control and, more importantly, a priceless historical record of your journey as an artist.
Setting Up Your Tracking Sheet
Getting started is a piece of cake. Just open a new sheet in Google Sheets or Excel and create a few basic columns. At a minimum, you’ll want Date, Monthly Listeners, and Followers. This is the skeleton of your historical data log.
But here's the secret sauce—the thing that makes this whole process worthwhile. Add a column and label it Notes. This is where the real magic happens. Data without context is just a set of random numbers. Your "Notes" column is where you'll finally connect the dots between what you do and how your audience reacts.
Making Your Data Tell a Story
That 'Notes' column turns your spreadsheet from a boring log into a powerful strategic journal. This is where you'll jot down every single thing you do that might nudge your listener count up or down.
Seriously, log everything that matters:
New Single Release: Note the exact date your new track dropped.
Playlist Placements: Record when you got added to a big playlist, whether it's an official Spotify editorial or a popular user-curated one.
Press Mentions: Did a music blog review your song? Write it down.
Social Media Campaigns: Note when you kicked off a new ad campaign or had a post unexpectedly blow up on TikTok.
Doing this gives you a direct, unfiltered look at cause and effect. Did your listeners suddenly jump by 10,000 the week after that blog feature? Now you have proof. Did a new single lead to a 15% spike in followers? That's a clear win you can learn from.
This simple flow—from raw data to real insight—is the core of any good analytics strategy, whether you're using a spreadsheet or a more advanced tool.
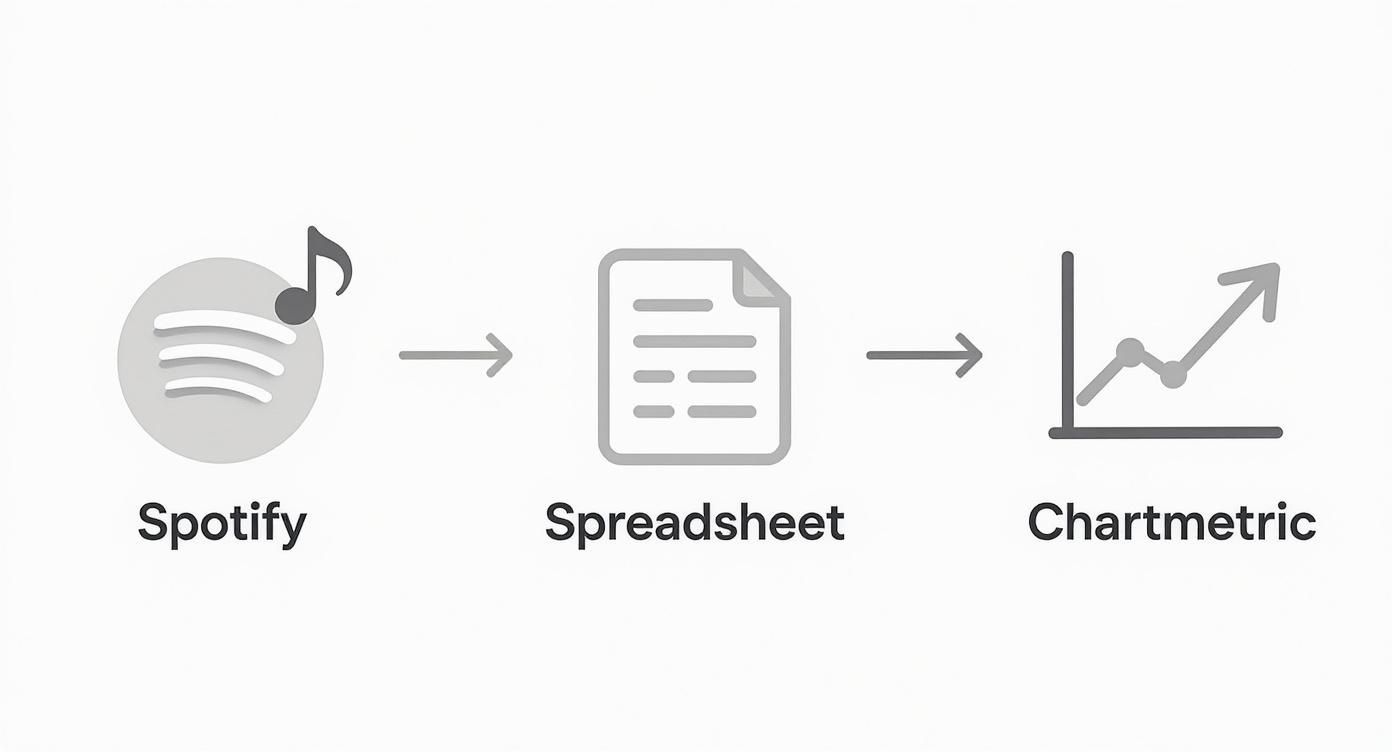
As you can see, the process starts with collecting the numbers, but the real value comes when you organize and analyze them to spot the trends that matter.
Build the Habit, See the Results
Look, a tracking system is only as good as the data you put into it. The key to making this work is consistency. The best way to do it is to log your numbers on the same day each week—say, every Monday morning.
To make this second nature, just set a recurring reminder in your calendar. It takes the guesswork out of the equation and ensures you never miss a beat. After just a few months, this simple habit will build a rich dataset that tells the unique story of your music's growth. If you want to take your analysis even further, our guide on Spotify data visualization can help you unlock music insights fast.
By logging your marketing efforts right next to your listener stats, you're creating a powerful feedback loop. You're no longer guessing what works; you're building a historical map that clearly shows which roads lead to growth.
This manual system puts the power back in your hands. It's the most direct way to understand the real-world impact of your hard work, learn from your past, and build a more sustainable future for your music.
How to Read The Story Your Data Is Telling
Pulling your data is just the starting line. Learning to actually read the patterns in your Spotify monthly listeners over time is the real game-changer. That graph isn't just a line—it's the story of your career's recent history, packed with clues about what’s creating a genuine connection with your audience.
Understanding these trend lines is how you graduate from just watching numbers to making sharp, strategic moves.
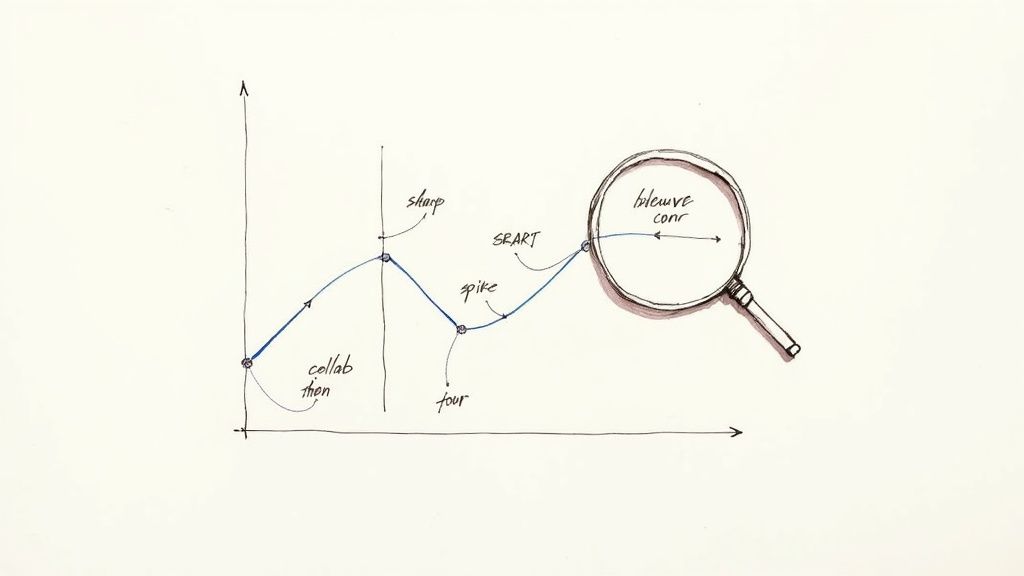
Take a close look at your chart. Every single dip and spike has a reason behind it.
See a massive, sudden spike that disappears almost as fast as it came? That’s usually the footprint of a viral moment—maybe a TikTok sound took off or you landed a huge playlist that has since expired. It's a great adrenaline rush, but it's often temporary.
What you're really looking for is that slow, steady climb. This is the hallmark of sustainable, organic growth. It tells you your core fanbase is getting bigger, people are digging into your back catalog, and your marketing is building real momentum, not just short-term hype. Honestly, that's the trend line that should get you the most excited.
Connecting Data Points to Real-World Events
Your listener data becomes incredibly powerful once you start cross-referencing it with the "Notes" column in your tracking sheet. This is where you connect the dots and see exactly how something you did translated into audience growth.
Here’s how to break down a few common scenarios:
A Release Spike: You dropped a new single, so of course, you see a jump. The real question is what happens after the initial buzz. Does the number settle at a new, higher baseline, or does it crash back down to where it was before? A higher baseline is gold—it means you turned fresh ears into engaged fans.
The Playlist Effect: Getting added to a big editorial playlist like Fresh Finds will give you a major, immediate boost. By tracking this, you can measure the playlist's true impact and, more importantly, see how many of those listeners stick around after your track is rotated out.
Tour Announcement Lifts: Did you notice a little bump in listeners in the cities you just announced on your tour schedule? That’s direct feedback telling you where your regional marketing is hitting the mark.
This process shifts you from being a passive observer to an active strategist. You're no longer just staring at numbers; you're understanding the cause and effect driving your career forward and pinpointing the exact actions that deliver the goods.
Understanding Your Global Audience Footprint
As you start piecing the story together, don't forget the global context. Spotify's user base is massive and diverse. Geographically, about 26% of Spotify’s monthly active users are in Europe, with North and Latin America making up another 38%.
The remaining 36% are scattered across the rest of the world, which shows just how much the platform is growing in places like Asia, Africa, and Oceania. You can dig deeper into Spotify's global user distribution on Backlinko.com.
Key Takeaway: The goal here is to build a narrative from your data. You should be able to answer questions like, "What was the single most impactful thing I did last quarter?" or "Which type of collaboration brings in the most dedicated listeners?"
When you can answer those questions with confidence—backed by your own historical data—you’ve unlocked the true power of tracking your Spotify monthly listeners over time.
Turn Your Insights Into Marketing Wins
Collecting data is one thing. Actually using it to build your future is something else entirely. Your historical listener data is a goldmine of strategic intelligence, showing you exactly what gets your audience excited.
Now, it's time to turn those patterns and spikes into concrete, repeatable marketing actions that drive real, sustainable growth. This is where you stop guessing what works and start building a strategy based on hard evidence from your Spotify monthly listeners over time.
Replicate Your Playlist Success
Let's walk through a common scenario. You're looking at your tracking sheet and see a massive listener spike from three weeks back. A quick look at your notes tells you why: you landed on a popular user-curated playlist called "Late Night Chill Hop." That one placement brought in thousands of new ears.
Don't just let that be a one-time win. That playlist's success is your new road map. The data is practically screaming that your music is a perfect fit for a specific mood and genre. So, what's next? Your mission is to find more playlists just like it.
Fire up tools that let you search for playlists by genre, mood, or even keywords like "chill hop" or "lofi study." Dig up dozens of similar playlists and start the slow, steady work of building relationships with their curators. This kind of targeted outreach is so much more effective than blindly pitching to random people because you already have proof that this niche audience loves your sound.
Double Down on Winning Collaborations
Collaborations are another area where your data can give you a massive edge. Imagine you dropped a track with another artist six months ago, and your baseline monthly listeners jumped by 20% and—more importantly—stayed there. That's not a temporary bump. It's a clear signal that your audiences have a powerful and lasting crossover appeal.
This single insight should immediately shape your next moves:
Find Similar Artists: Start exploring other artists bubbling up in that collaborator's specific subgenre. It's a safe bet their listeners will be open to your music, too.
Plan Future Projects: Why not reach out to that same artist for another go? A follow-up single or even a small EP is a no-brainer when you already have a proven track record of success together.
Target Their Fanbase: The next time you run social media ads for a release, specifically target the fans of your previous collaborator. You already know they're a warm audience.
By systematically finding and repeating what works, you create a powerful growth engine. For even more ideas, our guide on the top music promotion strategies can help you grow your audience in 2025.
Key Insight: Your historical data is your most persuasive asset. A chart showing steady listener growth is more compelling to labels, agents, and brand partners than any press quote.
This data-first approach lets you make smarter, more impactful marketing decisions. You stop wasting time and money on strategies that don't connect and instead pour your energy into the proven tactics that build a dedicated, long-term fanbase.
As you start digging into your listener data, you’ll notice a few questions pop up again and again. Getting a handle on these metrics is the only way to accurately track your Spotify monthly listeners over time. Let’s clear up some of the usual suspects.
Right off the bat, it's so important to understand the difference between your listeners, streams, and followers. They each paint a very different picture of your career.
Listeners: These are the unique individuals who've played your music in the last 28 days. Think of this as your active reach right now.
Streams: This is the raw number of plays your songs have racked up. It’s all about total consumption.
Followers: These are your die-hard fans who’ve hit that "Follow" button to get updates. This is your core community, the ones who are in it for the long haul.
A simple way to look at it: listeners show you the size of your current audience, while followers represent the loyal foundation you're building.
Why Did My Listeners Suddenly Drop?
Seeing a sudden nosedive in your monthly listeners can be a real gut-punch, but don't hit the panic button just yet—it's completely normal. In almost every case, this happens when you roll off a big playlist.
Remember, the listener metric is a rolling 28-day window. So, that big audience you gained from a major playlist feature will naturally cycle out after that period. A drop can also happen once the initial buzz from a new single starts to cool off.
The goal isn't to prevent every single dip. What you really want is to establish a higher baseline of listeners after each peak. That's the real sign of sustainable growth. It proves you're turning temporary buzz into long-term fans.
How Often Should I Log My Data?
I get it, the temptation to check your stats every day is strong. But honestly, it often does more harm than good. The numbers can jump around for all sorts of minor reasons, and obsessing over those daily fluctuations is a fast track to unnecessary stress.
The best approach? Log your data consistently, once a week.
This weekly check-in gives you a much better high-level view of your trends. It helps you spot the patterns that actually matter without getting bogged down in the day-to-day noise. Consistency is way more important than frequency. This simple habit builds the rich historical data you need to make genuinely smart, strategic moves for your career.
Ready to stop guessing and start tracking your growth with real precision? The artist.tools Monthly Listeners Tracker automatically logs your data so you never miss a thing. See your history, understand your trends, and build a smarter career.
.png)