Spotify Data Visualization: Unlock Music Insights Fast
- Jun 22, 2025
- 15 min read
Why Your Streaming Numbers Tell Stories You're Missing
Your latest track just hit 10,000 streams. That number, sitting plainly in your analytics, feels like a milestone. But what does it truly mean? Is it the start of viral momentum, or a temporary spike from a single playlist that will fade by next week? This is a core problem for millions of artists: you’re surrounded by numbers but starved for real answers. Raw data, like a list of ingredients, doesn't tell you how to cook the meal. Spotify data visualization is the recipe, turning those confusing numbers into clear, actionable stories about your music's journey.
Think of your streaming data as a silent film. The raw numbers—streams, listeners, followers—are just disjointed scenes. Without context, the plot is lost. You see a jump in plays but can’t pinpoint the cause. You notice a dip in listeners but don't know why they left. Visualization adds the subtitles and the soundtrack, revealing the narrative. It connects the dots between a playlist add in Brazil and a surge in listeners in Rio, or shows that while your streams are up, your save rate is declining—a critical warning sign that listeners aren't converting into long-term fans.
From Raw Numbers to Actionable Narratives
Simply looking at a spreadsheet of your daily streams is like trying to navigate a city with only a list of street names. You know where you are, but you have no map to show you the relationships between those streets. A Spotify data visualization tool acts as your career's GPS. It doesn't just show your current position; it maps out the entire landscape.
Here is a look at the standard Spotify interface, which presents a wealth of content for listeners to explore.
While this view is designed for music listeners, the underlying data holds immense power for creators when visualized correctly. Every stream, save, and playlist add is a data point generated within this massive ecosystem. The challenge lies in extracting and interpreting that data to inform your strategy.
This is especially critical when you consider the sheer scale of the platform. As of the second quarter of 2024, Spotify had 675 million active users globally, creating an immense sea of data. Tapping into this activity is essential for any artist looking to build a career. You can discover more about Spotify's user base and its global reach in detailed reports.
Uncovering Insights Beyond Spotify for Artists
The standard Spotify for Artists dashboard provides a solid foundation, but it often stops short of telling the whole story. It gives you the "what" but rarely the "why." Advanced platforms like artist.tools push beyond these limitations. They can visualize metrics that the native platform doesn't, such as Playlist Reach, which estimates the potential audience size of your playlist placements, or Popularity Score trends over time.
For instance, the Chart section in artist.tools allows you to see these crucial metrics plotted on a graph for any artist, track, or playlist. This visual representation can immediately highlight whether your growth is sustainable or if a track’s momentum is beginning to stall, allowing you to react with targeted promotion before it's too late. This isn't about being a data scientist; it's about being a smarter artist who makes decisions based on evidence, not guesswork.
The Hidden Metrics That Actually Drive Your Success
Beyond the surface-level appeal of play counts, a deeper layer of data tells the true story of your music's performance. Many artists focus only on streams, but that’s like judging a movie by its box office numbers alone—it completely misses the audience's reaction. The most effective Spotify data visualization decodes the hidden metrics that signal real connection and predict long-term success, moving beyond simple vanity numbers.
Think about stream completion rates. This single metric shows if listeners are engaged enough to finish your track or if they're just skipping through. High completion rates suggest your song's structure and production are hitting the mark. On the flip side, looking at skip rates at specific timestamps can pinpoint the exact moment—a weak intro, an awkward transition—where you lose your audience's attention. This isn't just data; it's a direct feedback loop for improving your craft.
Decoding Algorithmic Signals
Your music’s performance isn't just about human listeners; it’s also about how the Spotify algorithm sees your tracks. Several key metrics directly influence this perception, determining whether your music gets recommended to new audiences.
Playlist Addition Rate: This measures how often listeners add your song to their personal playlists. It's a powerful signal of long-term appeal and is often more predictive of sustained growth than an initial streaming spike.
Save Rate: When a listener saves your track, they're bookmarking it for later. This action is a strong indicator of fan conversion and tells the algorithm your music has lasting value.
Follower Growth Patterns: Steady follower growth shows that your music is not just being heard but is building a dedicated fanbase, which is a key factor in algorithmic promotion.
These metrics become exponentially more powerful when visualized. Below is a conceptual visualization showing how different tracks might perform on these key metrics, highlighting which ones are truly connecting with listeners.
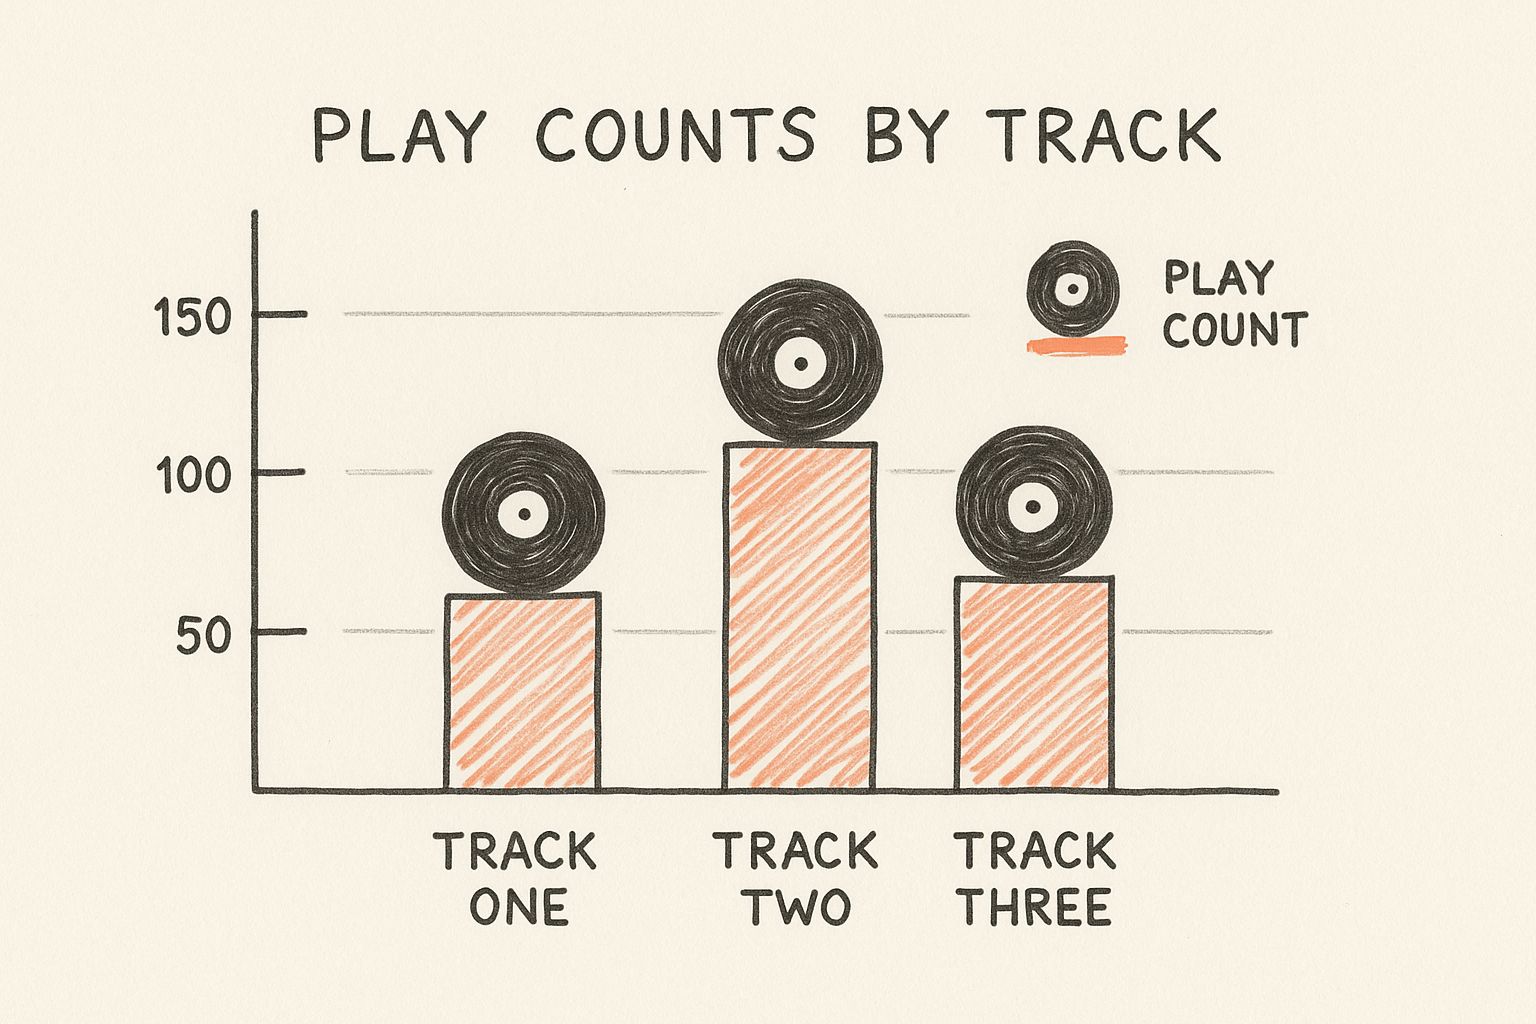
This kind of chart immediately shows that a track with fewer plays but higher engagement can be more valuable than a track with a fleeting, high-stream count.
Gaining a Competitive Edge with Advanced Tools
The standard Spotify for Artists dashboard provides a good starting point, but it doesn’t show you everything. To truly understand your performance, you need access to metrics that reveal the bigger picture. Platforms like artist.tools are built to visualize the data Spotify for Artists doesn’t provide, giving you a significant strategic advantage.
To understand the difference, let's compare the metrics available in the basic dashboard versus what advanced tools can offer.
Essential Spotify Metrics Comparison
Metric Type | Spotify for Artists | Advanced Tools (e.g., artist.tools) | Strategic Value |
|---|---|---|---|
Streams | Total stream count, daily streams | Historical stream data, stream source breakdown | Basic performance tracking vs. understanding where streams come from. |
Listeners | Total listeners, daily listeners | Listener-to-follower conversion rate, active listener trends | Gauging audience size vs. measuring audience loyalty and conversion. |
Playlist Data | Top editorial & algorithmic playlists | Playlist Reach, Playlist Health (bot detection), curator contacts | Seeing top placements vs. assessing the quality and potential impact of every playlist. |
Algorithmic Score | Not available | Popularity Score tracking over time | No visibility vs. directly monitoring your song's standing with the Spotify algorithm. |
Engagement Rate | Not available | Save Rate, Playlist Addition Rate | Blind to engagement vs. seeing clear signals of fan connection and long-term value. |
This comparison shows a clear gap. While Spotify for Artists tells you what is happening, advanced tools explain why it's happening and how you can influence it.
For instance, the Chart section within artist.tools can plot crucial indicators like Playlist Reach and Popularity Score over time. Playlist Reach estimates the potential audience of your placements, while the Popularity Score is Spotify’s internal ranking that heavily influences algorithmic playlists. Seeing these trends visually helps you understand if your promotional efforts are actually improving your standing with the algorithm or if you need to adjust your strategy. You can learn how to boost your music career with Spotify stream data insights by digging deeper into these advanced analytics. By focusing on these hidden metrics, you can make informed decisions that lead to real, sustainable career growth.
Reading the Global Music Landscape Through Data
Every stream on Spotify isn't just a number; it's a footprint from a real person with their own listening habits, cultural background, and ways of discovering new music. When you translate this global audience data into visuals, it reveals fascinating opportunities many artists miss. Think of a Spotify data visualization focused on geography and demographics as a cultural map. It shows you not just where your listeners are, but who they are and what shapes their musical taste.
With tools like heat maps and demographic charts, you can see how musical preferences change from one region to another. This isn't just an academic exercise; it's practical intelligence for your career. Knowing these patterns helps you make smarter decisions: what languages to use in your lyrics, where to plan your next tour, how to spend marketing money, and which cross-cultural collaborations could open doors to new audiences. Visualizing this data makes complex information clear, helping you build a lasting career by understanding exactly who listens to your music and why.
Uncovering Audience Demographics and Regional Trends
Visualizing listener data lets you break down your audience into meaningful groups. Age demographics, for instance, tell a powerful story about music discovery. Younger listeners might find your tracks through viral social media trends, while older fans often show deeper engagement by listening to full albums. Gender distribution helps you understand your core supporters and find chances to broaden your appeal. This level of detail is essential for crafting a message that connects personally.
The table below breaks down Spotify's global user base, offering a glimpse into where the largest listener pools are concentrated.
Spotify Regional User Distribution
Breaking down Spotify's global user base by region with demographic insights
Region | User Percentage | Total Users (Millions) | Key Demographics |
|---|---|---|---|
Europe | 28% | ~179 | Diverse markets; strong local music scenes; high Premium subscriber rate. |
North America | 22% | ~141 | High-value market; strong influence from playlists and radio. |
Latin America | 22% | ~141 | Rapidly growing user base; strong preference for reggaeton, pop, and local genres. |
Rest of World | 28% | ~179 | Includes Asia, Africa, and Oceania; highly diverse with significant growth potential. |
Note: Percentages are based on 2024 data for Monthly Active Users. Total user numbers are estimates based on Spotify's reported 640 million MAUs.
This breakdown shows massive listener pools, each with unique cultural flavors. The same data indicates that 62% of Spotify users are Gen Z, highlighting the importance of understanding youth-driven trends. For more details on these figures, you can explore the demographics shaping the global music scene. Understanding your place within these larger trends is the first step toward growth.
Turning Geographical Data Into Strategic Action
While Spotify for Artists offers basic location data, more advanced platforms provide the tools to truly act on it. Platforms like [artist.tools](https://www.artist.tools) go a step further by visualizing metrics that aren’t on the standard dashboard, such as Playlist Reach and Popularity Score trends, which can be cross-referenced with your geographical data. For example, the Chart section in artist.tools lets you see all core metrics for an artist or track charted over time.
This visual approach can show you if a spike in your Popularity Score lines up with playlist adds in a specific country. This connection is a powerful signal. Suddenly, you’re not just seeing a random listener increase in Germany; you see it was driven by three specific playlists, giving you a clear path for future promotion in that region.
This detailed insight allows for highly targeted strategies:
Tour Planning: Prioritize cities with a high density of listeners and strong engagement.
Marketing Spend: Put your budget into social media ads aimed at demographics and locations where you already have momentum.
Collaborations: Team up with artists who are popular in regions you want to enter.
By using Spotify data visualization, you move from just watching your global audience to actively engaging with them. For a deeper look at making your data work for you, check out our guide on how Spotify artist analytics can boost your music career.
Tools That Unlock What Spotify for Artists Won't Show You
While the native Spotify for Artists dashboard gives you the basics, the real career breakthroughs happen when you use tools that reveal the data Spotify keeps hidden. The market for these tools includes everything from simple chart generators to complex platforms that process millions of data points daily. Knowing which tool serves which purpose can change everything.
The need for clear, high-quality dashboards is so great that even Spotify itself has internal frameworks to manage the thousands of dashboards its own teams create. A 2023 report showed that Spotify employees made over 4,900 dashboards to track key metrics and reports. This proves that even with direct access to all the data, turning it into something useful requires dedicated visualization tools.
Visualizing the Metrics That Matter
Platforms like artist.tools stand out by turning complex data into intuitive visual stories. Its Chart section, for example, visualizes data that Spotify for Artists simply doesn't provide. This includes crucial metrics like Playlist Reach, which estimates the potential audience of every playlist you land on, and Popularity Score trends, which track your algorithmic performance over time.
For any artist, track, playlist, or curator, these charts display core metrics in time-based visualizations that make trends immediately obvious. The image below shows how artist.tools charts these trends, turning abstract numbers into a clear performance narrative.
This kind of Spotify data visualization immediately highlights connections you might otherwise miss, such as a drop in your Popularity Score after a decline in Playlist Reach.
Building Your Analytics Stack
Combining different tools helps you build a complete picture of your performance. You might use one tool for its powerful playlist discovery features and another for its in-depth listener demographic breakdowns. When looking for new ways to visualize your streaming data beyond Spotify for Artists, an ultimate guide to social media analytics dashboards can offer helpful ideas for building effective data presentations. The principles of creating clear, actionable dashboards apply everywhere, whether you're analyzing social media or streaming performance.
By combining data sources, you can create a personalized analytics stack that fits your specific needs. For instance, you could export CSV data from one platform and import it into another to create custom comparison charts. The goal is to build a system where you can:
Track Historical Performance: See how your key metrics, like monthly listeners and follower growth, have changed over months or even years.
Monitor Algorithmic Health: Keep an eye on your Popularity Score to ensure your music stays in favor with Spotify's recommendation systems.
Assess Playlist Quality: Analyze a playlist's follower growth and listener activity before you pitch your music, avoiding low-quality or botted placements.
Discover New Opportunities: Use advanced search and filtering to find relevant playlists and curators who are actively looking for new music.
Ultimately, the right tools help you move beyond just looking at past results. Instead of only analyzing what happened yesterday, you can start building a strategy based on what the data suggests will happen tomorrow, turning information into decisions that actively move your career forward.
Creating Visuals That Actually Drive Better Decisions
The real value of Spotify data visualization isn’t in making pretty charts; it’s about revealing the story hidden within your numbers. A confusing graph just adds to the noise, but a well-designed visual gives you an instant insight that tells you exactly what to do next. Crafting these visuals starts with a clear goal. Are you trying to pinpoint your next tour city, figure out why a track isn't performing, or show your growth to a potential collaborator? Your goal determines the format.
For example, a simple time-series chart is perfect for tracking streaming growth over months or identifying seasonal listening habits. A geographic heat map can instantly show you where your music is most popular, highlighting unexpected fanbases in cities you might have overlooked. While a basic pie chart gives a quick glance at your audience's gender or age, a scatter plot is much more effective for uncovering hidden relationships, like how an increase in your save rate affects your algorithmic Popularity Score. Each format is a tool to answer a specific question.
Designing for Clarity and Action
Once you have the right format, the design is everything. The objective is to inspire action, not overwhelm the person looking at the data. Simple design choices can make a world of difference. Using warm colors like orange or red can signal growth and opportunity, while cooler colors like blue or gray might point to areas that need more attention. This subtle psychological cue helps guide interpretation without cluttering the visual with too much text.
Interactive elements, like those in the Chart section of **artist.tools**, let you explore the data dynamically. You can hover over a specific point to see exact numbers or filter the view to compare different timeframes. However, this functionality needs to be balanced with clarity. A dashboard with too many moving parts can be more confusing than a static spreadsheet. This is why tools like artist.tools focus on showing core metrics—like Playlist Reach and Popularity Score—in clean, easy-to-read charts that emphasize trends over time.
From Data Points to a Compelling Narrative
The most powerful visualizations are arranged to tell a story. You could start with a broad overview of your monthly listeners, then drill down into geographic data to show where that growth is coming from. Finally, you might present a playlist chart that reveals the exact placements driving that regional success. To truly turn your streaming numbers into useful insights, you can apply the principles of a well-structured social media analytics report template. The core idea is the same: organize data to build a narrative that leads to an obvious conclusion.
By learning to create visuals that answer specific questions, you shift from passively looking at data to actively using it to build your career. For a closer look at the specific metrics you can visualize, our guide on Spotify analytics for artists offers practical examples. Ultimately, the best Spotify data visualization is one that not only shows you what happened but makes it clear what you should do next.
Real Artists, Real Results: Data Visualization Success Stories
Theories are just ideas until they deliver real-world results. For musicians, the true test of Spotify data visualization is seeing it translate into actual career growth—more listeners, smarter tour planning, and a stronger relationship with Spotify's algorithm. Across the board, from independent artists building their names to A&R teams at major labels, visual analytics are replacing guesswork with informed strategy. These aren't just concepts; they are the stories of artists who used data to forge their own paths.
The Independent Artist's Breakthrough
Imagine an indie musician watching their monthly listeners climb. On the surface, it’s a clear victory. But by digging deeper with a platform like artist.tools, they uncovered a more complicated picture. The Chart section in artist.tools visualizes metrics that Spotify for Artists doesn't show, like historical Playlist Reach and Popularity Score trends.
Here’s what the data revealed:
Shrinking Playlist Reach: Even though streams from a couple of big playlists were steady, their overall reach was declining. They were falling off smaller, but still influential, playlists.
Flatlining Popularity Score: The visual chart showed their algorithmic score had hit a plateau. This lack of new playlist adds was a major red flag for the Spotify algorithm.
This critical insight, made clear through a time-series chart, prompted a change in strategy. The artist focused on a targeted campaign to get placements on dozens of smaller, niche playlists. In just a few weeks, their Playlist Reach bounced back, their Popularity Score started climbing again, and their monthly listener growth became much more stable. It's a prime example of how data visualization can expose a hidden risk that raw numbers would have easily missed.
From Demographics to Sold-Out Shows
Another success story comes from a folk artist who assumed their music was for an older, rural audience. Old-school thinking would have pointed them toward booking tours in small towns. However, a demographic visualization painted a very different picture. A heat map of their listeners showed unexpected clusters in major cities like London, Berlin, and New York City.
When they looked closer, they discovered that a large part of their audience in these cities was between the ages of 22 and 30. This single discovery completely flipped their touring and marketing approach. They started booking venues in these urban markets and tailored their social media ads to a younger demographic. The result was a significant boost in ticket sales and audience engagement. This wasn't luck; it was a smart decision backed by clear visual data that challenged outdated industry assumptions.
The Curator and Supervisor Perspective
The advantages of data visualization aren't limited to artists. Playlist curators use visual analytics to track listener engagement and fine-tune their tracklists. A simple chart showing skip rates helps them spot and remove underperforming songs, which improves the playlist's overall retention. Likewise, music supervisors for film and TV use Spotify data visualization to find up-and-coming tracks with strong regional momentum, helping them find the perfect song for a scene before it breaks globally.
Each of these examples highlights a key truth: good data visualization doesn't just tell you what happened. It helps explain why it happened and points to the specific steps you should take next. It turns millions of data points into a clear map for your career, guiding you toward tangible, measurable growth.
Your Next Steps: Getting Started With Music Data Visualization
Ready to turn your streaming numbers into a clear roadmap for your career? Getting started with Spotify data visualization doesn't mean you need a degree in data science. It simply starts with asking the right questions and finding the tools that fit your goals as an artist. Success begins by knowing what you want to achieve. Are you focused on growing your monthly listeners, landing better playlist placements, or understanding who your audience is and where they live? Your goals will shape which numbers you watch and how you look at them.
A great first step is to get familiar with the data inside your Spotify for Artists account. Understand what those numbers mean. From there, you can bring in more powerful platforms to uncover the insights that truly move the needle. This is where tools that can visualize data beyond the basics become so valuable.
Building Your Data Review Habit
The secret to making data work for you is consistency. Setting up a regular schedule to check your numbers is how you turn raw data into a real strategy.
During Active Releases: Check your core metrics every week. Look for sudden jumps in streams, listener engagement, and playlist adds to see what’s connecting with people in real time.
For Long-Term Planning: Do a deeper dive once a month. Analyze trends in your follower growth, identify geographic hotspots, and monitor your algorithmic health to guide your bigger picture plans.
Make sure to write down what you find. A simple note like, "Added to 'Chill Lofi Beats' on Tuesday, saw a 15% listener increase in Germany by Friday," is incredibly useful. Tracking which actions lead to real results turns data review from a chore into a powerful feedback loop for your career.
From Basic Dashboards to Advanced Insights
Don't overwhelm yourself by trying to track everything at once. Begin by setting up a simple dashboard focused on your key metrics: monthly listeners, follower growth, and your top-performing tracks. As you get more comfortable reading this data, you can start digging deeper. This is where a specialized platform like artist.tools offers a major advantage.
The Chart section in artist.tools is built to visualize data that the standard Spotify dashboard doesn't show, such as:
Playlist Reach: See the potential audience size of your playlist placements charted over time. This reveals the true impact of every single add, not just the name of the playlist.
Popularity Score Trends: Keep an eye on your algorithmic health with a clear graph. This shows how your promotional efforts are influencing your standing within Spotify's system.
Visualizing these metrics for an artist, a track, or even a specific playlist curator helps you see connections that would otherwise be invisible. You might spot a declining Popularity Score and trace it back to a drop in your overall Playlist Reach, giving you a clear problem to solve.
Remember, the goal of visualization is to drive decisions, not just satisfy curiosity. Don’t let the idea of a "perfect" dashboard stop you from getting started. Begin with the tools you have, and adjust your methods as you learn what works for your music. Build a habit of regular data review, celebrate the wins when your numbers go up, and use these insights to make smarter, more confident choices for your career.
.png)
Comments