Mastering Music Data Analytics for Artists
- Jul 17, 2025
- 15 min read
Picture this: you have a direct line to your fans. You don't just know that they're listening, but you understand how and why they're connecting with your music on a deeper level.
That’s the real power of music data analytics. Think of it as your new favorite instrument, one designed specifically to grow your career.
The New Sound of Success in the Streaming Era
The music world has flipped. We've moved from a physical sales model to a massive global streaming ecosystem. Because of this shift, understanding listener data is no longer a perk for major labels—it's a must-have skill for any independent artist trying to build a real, sustainable career.
Don't let the term "data analytics" scare you off. It’s not some complicated chore. It's simply the bridge between your art and your audience. It takes all those abstract numbers and turns them into a practical roadmap, showing you exactly how to find a loyal, engaged fanbase and unlock real opportunities.
Every single stream, save, and playlist add tells a part of your music's story.
From Radio Spins to Streaming Wins
Not too long ago, success was all about radio plays and album sales. Those were metrics that were, for the most part, completely out of an artist's hands.
Today, the game is totally different. The streaming world gives you a firehose of information that was once impossible to get, offering a direct window into your audience’s habits.
This data-first mindset is more critical than ever. Streaming has completely reshaped the music business, now making up 84% of the industry's total revenue. The market is exploding, growing by over 10% in 2023 to hit $17.5 billion, and it's on track to reach nearly $30 billion by 2027. You can dive deeper into these trends and their impact on music streaming statistics.
By learning to read this data, you’re not just looking at numbers. You're gaining the power to make smart decisions that directly fuel your growth, turning casual listeners into dedicated fans for life.
Why This Matters for Independent Artists
As an indie artist, you know that every move counts. Your marketing budget isn't endless, your time is precious, and that connection with your fans is your single greatest strength. Music data analytics helps you make the most of all three.
Instead of guessing where your fans are, you'll know. Instead of hoping a track connects, you'll see the proof.
This guide is here to pull back the curtain on the whole process. We’ll give you a clear path to understanding the key metrics and building a workflow you can use over and over. You’ll learn how to use powerful platforms to:
Identify Your Core Audience: Pinpoint exactly who is listening—their age, gender, and where they live.
Track Song Performance: See which tracks are hitting the hardest and understand the entire lifecycle of your releases.
Discover Growth Opportunities: Uncover the specific playlists, cities, and even countries that are driving your streams.
By the time you finish this guide, you won't just see numbers on a screen. You'll see a clear, actionable strategy to take your music career to the next level.
What Exactly Is Music Data Analytics
So, what’s all the buzz about music data analytics? Let’s cut through the noise.
Think of it as learning to read your audience’s digital body language. Back in the day, you'd gauge a song's success by the applause at a live show or how many t-shirts you sold. Now, you’re watching how millions of people react to your music on streaming platforms in real-time.
This isn’t about being a math whiz or getting buried in spreadsheets. It’s about turning clicks, streams, and saves into a clear story about your music's journey. Every single action a listener takes is a piece of feedback, telling you what’s hitting home and what isn't.
If your song is a conversation, data analytics lets you hear what the entire room is saying—not just the folks in the front row. You can pinpoint which parts people are rewinding, who’s sharing your track, and where in the world these listeners are. It’s a game-changer.
The Building Blocks of Listener Behavior
To get the full picture, you need to start with the individual pieces. Each metric tells its own little story about how a fan interacts with your song. These aren't just numbers on a screen; they're direct signals of how much people are connecting with what you’ve created.
Here are the core actions that make up music data analytics:
Streams: The most basic starting point. A stream is a single listen, counted when someone plays your track for over 30 seconds on Spotify. It's the first sign of discovery.
Listeners: This number counts the unique people who streamed your music. One listener can rack up dozens of streams, so comparing these two metrics shows you how deep the obsession goes.
Saves: When a fan "saves" your song, they're adding it to their personal library—their "Liked Songs." This is a massive vote of confidence. They’re basically saying, "I want this song in my life."
Playlist Adds: This is where your music becomes part of someone's soundtrack. Whether it’s for a "Late Night Drive" or "Gym Motivation" playlist, your track is now woven into their daily routine.
Each action builds on the last, painting a clearer and clearer picture of a song's journey from a random discovery to an absolute favorite. For a deeper look, our guide on Spotify data analytics for modern artists shows exactly how these pieces fit together.
By learning to interpret this digital body language, you move from hoping your music connects to knowing how it connects. It’s the difference between shouting into the void and having a meaningful, strategic conversation with your global audience.
Understanding Core Music Metrics
Getting a handle on these key metrics is the first step. The real magic happens when you see how they influence each other and what stories they tell when combined. This table breaks down the essentials.
Metric | What It Measures | Why It Matters for Artists |
|---|---|---|
Streams | The total number of times your song has been played for at least 30 seconds. | Indicates initial reach and discovery. High streams show your music is getting heard. |
Listeners | The number of unique people who have streamed your music. | Measures the size of your audience. Comparing listeners to streams reveals listening frequency. |
Saves | When a listener adds your track to their personal library ("Liked Songs"). | A strong indicator of fan love and long-term potential. High saves tell algorithms your song is a keeper. |
Playlist Adds | The number of times your song is added to any user-created or editorial playlist. | Shows your music has context and utility, becoming part of fans' daily lives and moods. |
Looking at these metrics together gives you powerful insights. For instance, a track might have tons of streams but very few saves. This often means it’s getting played on big playlists but isn't quite converting those casual listeners into dedicated fans.
On the flip side, a song with fewer streams but a super high save rate points to a small but fiercely passionate fanbase. That’s a powerful signal telling you exactly where to focus your energy.
Okay, you've got the basics of music data analytics down. Now it's time to get your hands dirty and turn all that theory into action.
Your Artist Dashboard Is Your Mission Control
The single most powerful tool you have is your artist dashboard, and for most of us, that means Spotify for Artists. Think of it less like a website and more like the mission control for your entire music career. It's where you get the critical intelligence needed to stop guessing and start making real, strategic decisions.
This is where the raw numbers—streams, listeners, followers—start to paint a clear picture of who your audience is and how your music is performing in the wild. Getting comfortable here is your direct line to understanding who your fans are, where they live, and exactly how they're finding your sound.
Here’s a look at the home screen, which is ground zero for all your key stats.
It gives you a high-level, real-time snapshot of your music's impact. It’s built to give you the most important numbers at a glance so you can quickly get a feel for how things are going.
Touring the Key Data Sections
Your Spotify for Artists dashboard is broken down into three main areas. Each one offers a unique angle on your performance. Mastering these is the first real step toward building a strategy that actually works.
Audience: This is your demographic deep dive. It tells you who is listening—their age, gender, and most importantly, where they are, right down to the city.
Music: This section is all about your catalog. It tracks the performance of individual songs and full releases, letting you see stream counts over time and compare how different tracks are holding up.
Playlists: Here’s where you discover how people find you. It shows which playlists are sending you the most streams, whether they’re algorithmic (like Discover Weekly), editorial (curated by Spotify), or just made by fans.
The Audience Tab: Who Is Listening?
For my money, the "Audience" tab is the most actionable section for any artist. It takes you beyond abstract listener counts and gives you a concrete profile of your fanbase.
Knowing that 25% of your listeners are 18-24-year-olds in a specific city isn't just a fun fact; it's powerful information. See an unexpected listener spike in Berlin? Maybe it's time to aim some social media ads at that city or start looking up local venues for a future tour. This is how data turns into real-world opportunities.
By digging into your audience demographics, you can tailor your content, messaging, and tour plans to the people who are already connecting with your music the most. It’s about focusing your resources where they will have the biggest impact.
From Data to Decisions: Practical Applications
The real magic happens when you start connecting the dots between these different sections. You can see which songs are hitting with certain age groups or how a playlist add in a new country suddenly puts a new city on your global map.
Let's walk through a real-world scenario.
Check Your Music Tab: You notice your new single is getting way more streams in its first week than your last few releases. Something's working.
Investigate the Playlists Tab: You dig in and see the spike is coming from a handful of popular user-made "Indie Chill" playlists. Now you know the exact vibe your song is hitting.
Cross-Reference the Audience Tab: You look at the top cities for this track and see Austin, Texas is now number one—a place that wasn't even in your top ten before.
Take Action: The path forward is clear. You can use a platform like [artist.tools](https://www.artist.tools/) to find and pitch other "Indie Chill" curators. At the same time, you can run a small, targeted ad campaign for potential fans in Austin to pour some gas on that organic fire.
This is the exact repeatable workflow that builds careers. It's a simple cycle: release music, analyze the feedback, figure out what's resonating, and then double down on it.
Translating Data into Audience Behavior

Knowing your basic metrics is just the start. The real magic of music data analytics is learning how to turn those raw numbers into a clear story about your audience. This is where you graduate from seeing what happened to understanding why.
Think of your data as a direct feedback loop from your listeners. Every skip, save, and stream tells you something personal about how your music fits into their world. Once you learn to read these signals, you can turn passive data into active, career-defining decisions.
Reading the Signals of Engagement
This is where advanced metrics like Save Rate and Skip Rate come in. They’re like your audience’s digital body language, offering unfiltered feedback on a track's immediate impact and its staying power. These aren't just numbers; they're direct lines to emotional connection.
A high Save Rate (calculated simply as saves divided by listeners) is one of the most powerful green flags on Spotify. It means people aren't just hearing your song; they're actively choosing to keep it. It's the digital equivalent of a fan raising their hand and saying, "I need this in my life." This one action heavily influences Spotify's algorithms, often triggering placement on powerhouse playlists like Discover Weekly.
On the flip side, a high Skip Rate, especially in the first 30 seconds, is critical feedback you can’t afford to ignore. It could mean your intro isn't landing fast enough, or maybe the track was placed on a playlist where it just didn't match the vibe. Analyzing this helps you tighten up your intros and pitch to more suitable playlists next time.
By looking at Save Rate and Skip Rate together, you get a much richer picture of a song's performance. A track could have a low skip rate but also a low save rate, which suggests it’s pleasant but ultimately forgettable. The sweet spot is creating music that listeners not only finish but feel they have to own.
Deconstructing Your Stream Sources
It’s not just about how many streams you get—it’s about where they come from. Your "Source of Streams" data is basically a map showing the exact roads listeners are taking to find you. Cracking this code is the key to making success repeatable.
Your streams typically flow from a few key places:
Algorithmic Playlists: Think Discover Weekly and Radio. These are generated by Spotify's AI for each user. Landing here is a huge sign that your engagement metrics (like that all-important save rate) are catching the algorithm's attention.
Editorial Playlists: These are the big ones, curated by Spotify's internal teams. A placement here can give you a massive, immediate visibility boost and is a major career milestone.
User-Created Playlists: Never underestimate the power of fan-made compilations. A spike from a user's playlist can signal a grassroots trend and show you exactly what moods or activities people associate with your song.
Your Profile and Catalog: These streams come from your core fanbase—the people who actively seek you out. This is your foundation.
This data gives you the "why" behind your streams. If you see a surge from a user-made "Lofi Beats for Studying" playlist, you now have a laser-focused direction for your next pitch. To dive deeper, check out our guide on [how to spot streaming trends using Spotify analytics](https://www.artist.tools/post/how-to-spot-streaming-trends-using-spotify-analytics).
Connecting Data to Global Opportunities
Your audience data isn't just local; it’s a global report card. By keeping an eye on where your streams are coming from, you can uncover unexpected pockets of fans and build a smart international strategy.
Let's say you see a random stream spike in Brazil. At first, it might seem like a fluke. But dig into your playlist data, and you might find a popular local curator added your track. This isn't just a number—it's a massive opportunity. Now you can engage with that market through targeted social media, network with other Brazilian curators, or even start sketching out future tour dates.
This is more important than ever. While the U.S. saw a 4.6% YoY growth in on-demand audio streams recently, the rest of the world shot up by a staggering 12.6%. That’s where the future growth is.
Building a Repeatable Workflow for Growth
Understanding your data is one thing, but actually using it to build a growth engine for your music? That's a whole different ball game. The secret is to stop just looking at the numbers and start putting them to work. This means building a repeatable, cyclical workflow that turns those insights into real actions you can take with every single release.
This isn’t about a one-off promotional push. It’s about creating a sustainable system where the performance of one song directly informs the next, building momentum release after release. Think of it as a constant feedback loop for your career, where your audience’s behavior literally tells you what to do next.
The core idea is simple: Listen, Learn, Amplify, Repeat. You listen to what the early data is telling you, learn which signals are the strongest, push those positive signals harder, and then do it all over again to create consistent, predictable growth.
This is basically how you turn a bunch of raw numbers from Spotify and social media into a clear, actionable game plan.
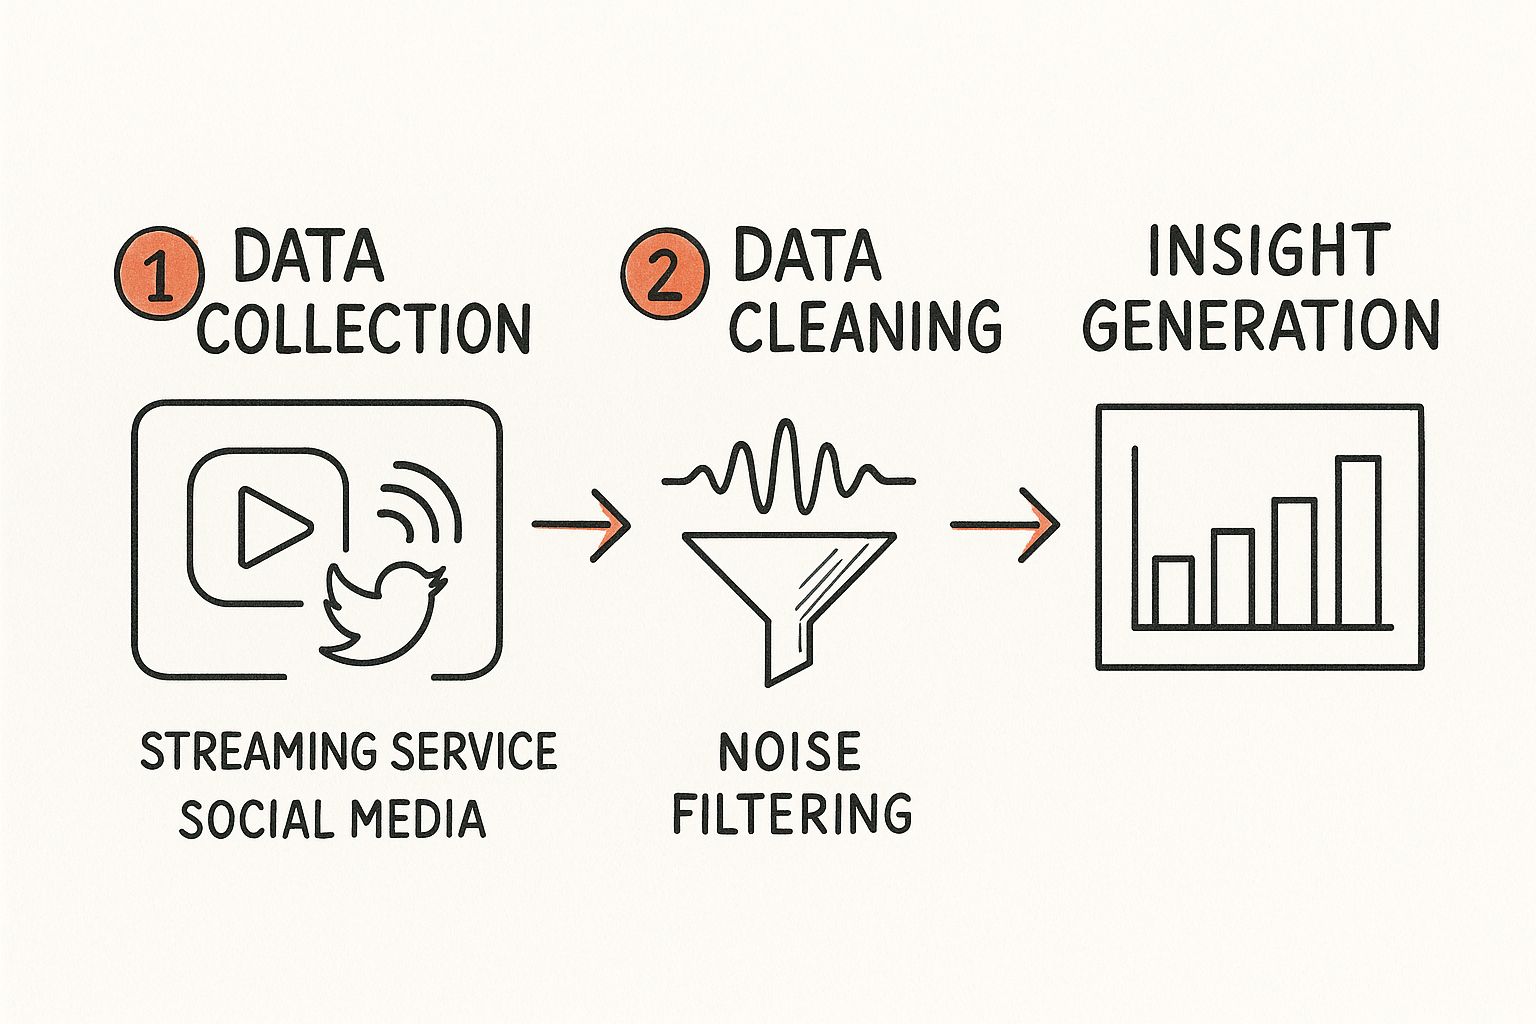
The graphic above breaks down that journey from scattered data points to a focused strategy that fuels your promotion.
The Five-Step Growth Cycle
So, how do you make this practical? Let’s break it down into five clear, actionable steps. Follow this cycle for every new track to start building a reliable pattern of growth.
Release and Monitor: The first 7-14 days after your song drops are everything. This is your prime window for gathering initial performance data. Keep a close eye on your streams, listeners, saves, and playlist adds in your Spotify for Artists dashboard.
Identify Positive Signals: Now, look for the metrics that are popping off. Is your save rate unusually high? Are you noticing adds to user-generated playlists with a specific vibe like "Late Night Focus" or "Morning Commute"? Pinpoint the exact cities or countries where your track is doing better than average.
Find Your Target Audience: Once you spot a trend—say, your track is getting traction on a bunch of "Indie Folk" playlists—you've just found your core audience. These are the people your sound is really connecting with right now. They're your target for the next move.
Amplify the Momentum: This is where you take action. Fire up a platform like **artist.tools** to find curators of other "Indie Folk" playlists and start pitching your track. If you saw a listener spike in Chicago, run a small, targeted social media ad campaign aimed at music lovers in that specific city.
Analyze and Inform: After your promotional push, check the results. Did pitching those playlists actually lead to more streams and saves? Did that ad campaign get you more followers in Chicago? Use whatever you learn to build the strategy for your next release.
This cycle transforms music data from a reactive report card into a proactive game plan.
From Data to Action with the Right Tools
Pulling off this workflow smoothly means having the right tools in your corner. While Spotify for Artists gives you the raw data, platforms like artist.tools add the strategic layer you need to actually act on it.
The platform is essentially a suite of tools built to help you find and verify the exact playlist opportunities your data is pointing you toward.
For instance, after you've identified a positive signal (Step 2), you can jump into the Playlist Search feature to uncover hundreds of other playlists that fit that same theme or genre. From there, you can analyze each one to make sure it's packed with real, engaged listeners before you even think about reaching out.
This approach is critical for success on Spotify, which dominates with 31% of the global streaming market share. With over 500 million users, its AI-powered playlists are a primary driver of music discovery, making smart playlist pitching a cornerstone of any growth strategy. Discover more stats about music streaming you need to know.
By building this repeatable workflow, you stop chasing random opportunities and start creating your own. Each release becomes a new experiment, giving you fresh data that sharpens your strategy, deepens your connection with your audience, and builds a truly sustainable music career.
Frequently Asked Questions About Music Data
Diving into music data can feel like learning a new instrument. It’s totally normal to have questions as you get started. Let's walk through some of the most common ones we hear from artists and their teams to get you moving forward with confidence.
These aren't just technical questions; they get to the heart of the strategic challenges that can make a real difference in how you read your performance and plan your next move.
How Often Should I Check My Music Data?
This is a fantastic question because finding the right rhythm is everything. You want to stay on top of things without getting glued to the screen, obsessing over every single stream.
A good rule of thumb is to check your analytics daily for the first 7-14 days after a new song drops. This window is absolutely critical. It's where you'll spot early trends, see those first exciting playlist adds, and get an immediate feel for how your audience is reacting.
Once that initial buzz period is over, you can pull back a bit. A weekly check-in is usually perfect. This lets you keep an eye on your overall growth and see how your promo efforts are paying off, all without getting lost in the noise of daily ups and downs.
What Is a Good Save Rate on Spotify?
While Spotify keeps its official benchmarks under wraps, the industry has a pretty solid consensus on what a "good" save rate looks like. It’s a metric you really want to pay attention to.
A save rate above 20% is widely considered a powerful signal of high listener engagement. If you're hitting 30% or even 40%, that's exceptional territory.
Think of it this way: a stream means someone liked your song, but a save means they felt they needed to own it. That's a massive signal to Spotify's algorithm, telling it your track is a keeper and a prime candidate for powerful playlists like Discover Weekly and Radio.
Can I See Data for Other Artists?
You can't peek into another artist's private Spotify for Artists dashboard. That's their confidential space, filled with detailed listener demographics and specific stream sources.
But you can absolutely analyze publicly available data, and this is where things get interesting. Using third-party platforms like artist.tools, you can track any artist's monthly listeners, watch their follower growth, and see their playlist placements over time. This is your secret weapon for competitive analysis, discovering potential collaborators, and finding new playlist opportunities by seeing where similar artists are getting traction.
My Streams Are High but Followers Are Low. Why?
Ah, the classic scenario. This almost always points to one thing: your track has landed on some big, influential playlists. People are hearing and enjoying your song in a "lean-back" listening experience—they dig the vibe, but they aren't actively seeking out your artist profile to learn more.
The key is to bridge that gap and turn those passive listeners into active followers. You have to be direct.
Use Your Artist Pick: Pin your new single and add a quick note asking people to follow you for more music.
Update Your Canvas: Create a short, looping video for your track that includes a subtle call-to-action like "Follow for more."
Cross-Promote on Socials: Don't be shy! Directly ask your audience on Instagram, TikTok, or Twitter to follow you on Spotify.
While you're working on that, don't forget the financial side. High stream counts are great, but they need to translate into real income. You can get a much clearer picture of what your streams are worth by using a Spotify royalties calculator to build real music income.
Ready to stop guessing and start growing? The artist.tools platform is built to help you find the right playlist opportunities, analyze your competition, and build a repeatable strategy for success. Explore the tools and start making smarter decisions today.
.png)
.png)
Comments