Spotify Data Analytics for Modern Artists
- Jun 27, 2025
- 14 min read
Let's be real: staring at a screen full of numbers probably isn't why you got into music. But when it comes to growing your career on Spotify, that data is your direct line to the people who matter most—your listeners. Think of it less like a spreadsheet and more like a map, showing you exactly who your fans are, where they live, and how they’re finding your music.
Why Spotify Data Is Your Secret Weapon
Forget just chasing a bigger stream count. The real game is understanding the story behind those streams. It's about shifting your focus from a single metric to the bigger picture of how your music travels and connects with people across the globe.
This isn't just a small-time platform anymore. Back in 2015, Spotify had about 77 million active users. Today? That number has skyrocketed to over 675 million worldwide. That's a mind-blowing increase of more than 770%, meaning your potential audience is bigger, more diverse, and more spread out than ever. If you want to dig into it, you can discover more about Spotify's global user base growth and what that massive scale means for you as an artist.
Pinpoint Your Real Fanbase
Your most important listeners aren't just casual streamers. They're the ones who take action. They save your tracks, add them to their own playlists, and hit that "Follow" button on your profile. Your Spotify for Artists dashboard is where you can spot these champions of your music.
Pay close attention to these signals:
Save Rate: This is the percentage of listeners who save your song to their library. A high save rate sends a powerful message to Spotify's algorithm that your track has staying power.
Playlist Adds: See exactly which user-created playlists are giving your music a boost. This is how you find your superfans—the ones building a world around your sound.
Follower Growth: Keep an eye on how your follower numbers tick up, especially after a new release or a promo push. It’s a direct measure of your growing community.
Your data doesn't just tell you what happened. It hands you the proof you need to make smarter moves. It turns cold numbers into a clear story about your music's journey and shows you exactly where your next big opportunity is hiding.
Turn Those Numbers Into Action
The magic of spotify data analytics isn't in knowing the stats; it's in what you do with them.
Let’s say you drop a new single and notice a surprising spike in listeners from Berlin. Cool, right? But don't just stop there. That’s not a random stat—it's a massive clue. Now you can get strategic. Target your next Instagram ad campaign specifically to your fans in Berlin. Start pitching your music to influential German playlist curators. Maybe even add Berlin to the routing for your next tour.
And don't sleep on the "Listeners also like" section. It's an absolute goldmine. If it shows fans are also listening to an artist you've never heard of but who has a similar vibe, that's a new door opening. Maybe it’s a perfect collaboration opportunity or a chance to open for them on a local show. Every single data point is a breadcrumb leading you toward your next best move, helping you put your time and money where it will actually count.
To get started, it helps to have a clear picture of what you're even looking at inside your dashboard. Not all metrics are created equal, and some are far more valuable for making strategic decisions.
Here's a quick breakdown of the essential stats inside Spotify for Artists and what they really mean for your music career.
Key Metrics in Spotify for Artists and What They Actually Mean
Metric | What It Measures | Why It's Important for Artists |
|---|---|---|
Streams | The number of times a track is played for at least 30 seconds. | The most basic measure of reach. Consistent streams signal popularity to the algorithm. |
Listeners | The unique number of people who have streamed your music in a set period. | Tells you the actual size of your audience, separating it from repeat plays by the same fans. |
Saves | The number of listeners who have saved a track to their "Liked Songs" or personal library. | A huge indicator of fan commitment. Spotify's algorithm sees this as a major quality signal. |
Playlist Adds | The number of times your music has been added to any playlist (algorithmic, editorial, or user-generated). | Shows you where your discovery is happening. Crucial for identifying superfans and successful pitches. |
Followers | The total number of users who follow your artist profile. | Your most direct line of communication. Followers get notifications for your new releases, which drives initial stream velocity. |
Source of Streams | Breaks down where your streams are coming from (e.g., your profile, listener playlists, editorial playlists). | Helps you understand how people are discovering you so you can double down on what’s working. |
Audience Location | Shows you the top cities and countries where your listeners are. | Essential for planning tours, targeting social media ads, and focusing your promotional efforts. |
Knowing what these numbers mean is the first step. The next is learning how to connect the dots between them to build a powerful release strategy, find your fans, and keep them coming back for more.
Your Guide to the Spotify for Artists Dashboard
Jumping into your Spotify for Artists dashboard for the first time can feel like stepping into a cockpit full of unfamiliar buttons and dials. It’s absolutely packed with information, but knowing where to even start looking is half the battle. Let's break down the key areas without all the confusing industry jargon.
Think of the dashboard as your mission control for all things spotify data analytics. The main navigation is your friend, and it's usually split into three core tabs: Music, Audience, and Profile. Each one gives you a completely different—and equally important—view of how your music is performing and who it's connecting with.
Diving Into Your Music Tab
The Music tab is ground zero for track-by-track performance. This is where you can click on any specific song or release and really see what’s going on under the hood, moving from the big-picture numbers to the tiny details that matter.
Sure, you can see a song's lifetime streams, but the real power comes from checking its performance over the last 24 hours, 7 days, or 28 days. This is how you track the immediate impact of that new social media post you made or a fresh playlist add. This tab also holds the golden ticket: the Playlists section for each track. This shows you exactly which algorithmic, editorial, and user-generated playlists are sending you streams.
Don’t just get fixated on the total stream count. The real story is in the trends. A song that consistently pulls in 500 streams per day from genuine fan playlists is often a much healthier sign than a track that got 10,000 streams from a single editorial placement and then immediately fell off a cliff.
Understanding Your Audience Tab
If the Music tab tells you what people are playing, the Audience tab tells you who they are. This is where you stop guessing and start building a real, concrete picture of your fanbase. For any kind of marketing, this section is pure gold.
This part of the dashboard gives you a detailed breakdown of your listeners. You'll find things like:
Age and Gender: Get a clear look at the core demographics tuning in.
Top Countries and Cities: Find out where your music is hitting hardest. This is invaluable for planning potential tour stops or targeting your ad spend.
Listeners Also Like: See which other artists your fans have on heavy rotation. This is a perfect cheat sheet for finding potential collaborators or even bands to tour with.
To get a better sense of how Spotify's dashboard compares to other platforms, it can be useful to explore other top social media dashboard tools to see how they present audience data. And for a much deeper dive on using this info, our complete guide on how to boost your career with Spotify artist analytics is your next stop.
Curating Your Profile Tab
Finally, we have the Profile tab. This is where you get to take the wheel and shape your artist image directly. Think of it as your official storefront on Spotify—it’s one of the few places you can directly influence how listeners see you.
Here, you can update your bio, upload fresh press photos, and add a Canvas (that slick, short looping video that plays with your track). You can also feature an Artist Pick, which lets you pin a song, album, or playlist right at the top of your profile. This is your chance to turn a casual listener into a dedicated follower. At the end of the day, a well-kept profile signals to everyone that you're active, professional, and invested in your career.
Alright, let's get this done. Data is useless unless you know what to do with it. Watching your stream count go up is a great feeling, but the real magic happens when you start connecting those numbers to actual, real-world decisions.
This is where you stop asking "what happened?" and start asking "so what?" and "now what?"
From Insights to Opportunities
Let’s walk through a real-world example. You drop a new single. A week later, you're digging through your dashboard and notice a totally unexpected listener spike coming out of Berlin, Germany. Don't just shrug it off as a cool little tidbit. That's a direct signal. Your music is hitting a nerve there.
So, what’s your next move?
Targeted Ads: Spin up a targeted social media ad campaign aimed squarely at users in Berlin who are into artists similar to you.
Playlist Pitching: Start researching popular German music blogs or playlist curators. It's time to pitch your track.
This is how you turn a simple data point into a focused marketing push.
The same logic works for your "Listeners also like" data. If you keep seeing an artist you've never heard of pop up, it’s not just a coincidence. It's a clue. Go listen to their music. Is it a good fit with your vibe? This could be your way in for a collaboration pitch or even an opening slot on their next tour.
Think of it this way: website owners are obsessed with measuring success with key metrics to grow their business. As an artist, you need to do the same. Turn those passive numbers into an active game plan.
The infographic below breaks down how raw data gets crunched into the clean reports you see. It’s a whole process.
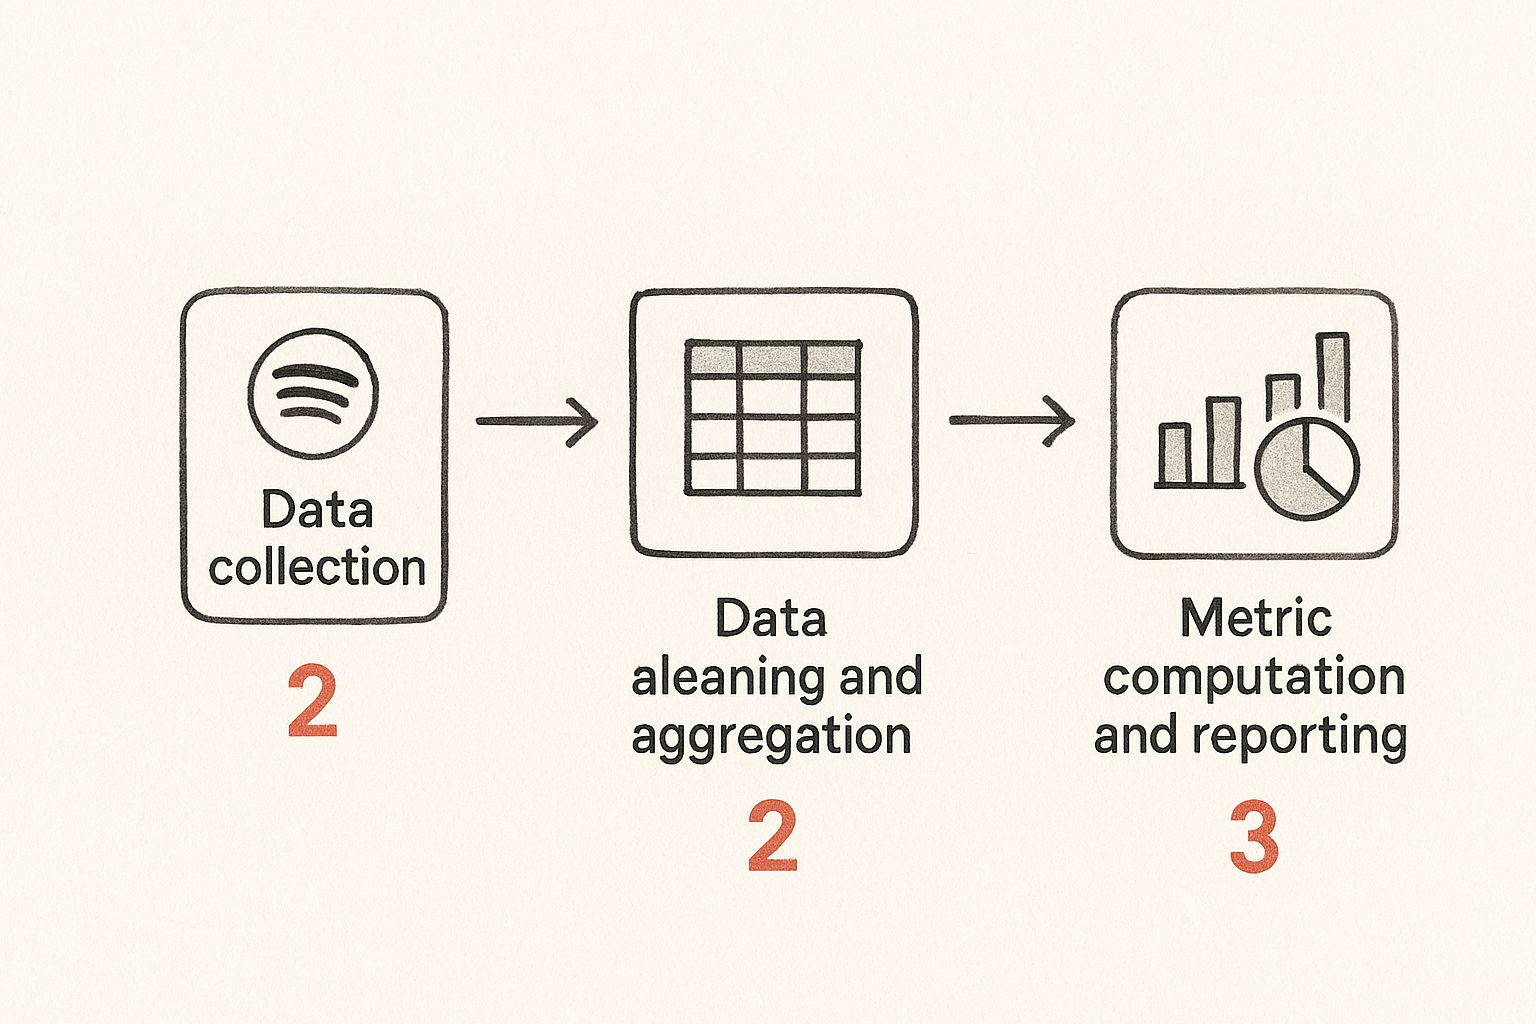
Understanding this flow from raw listening events to organized charts helps you trust the data. It's not just random noise; it's a cleaned-up reflection of how real people are interacting with your music.
Making Sense of a Massive Audience
This strategic thinking is vital because you’re dealing with a massive audience. Spotify recently reported 626 million monthly active users (MAUs), and 246 million of those are premium subscribers. That’s a huge pond to fish in.
Knowing a bit more about the general user base helps, too. For instance, 62% are Gen Z, and the audience leans slightly male (58%). This kind of info, which you can dig into with the latest Spotify user statistics, can help you tweak your visuals and your messaging to connect better.
The goal is to build a feedback loop: You see the data, you take action, and then you watch the data to see what happens next. Did that Berlin ad campaign get you more followers in Germany? Did that playlist pitch actually boost your streams?
This cycle of analysis, action, and reaction is what separates artists who just have data from those who use it to build a career. It's the difference between being a passenger and actually flying the plane.
Using Analytics to Get Your Music Playlisted
Landing on a major Spotify playlist can feel like winning the lottery, but it's much less about random luck than you might think. Getting that coveted placement is really a science, and your spotify data analytics is the formula. The secret is knowing what both human curators and the all-powerful algorithm are looking for.
You're mainly dealing with three kinds of playlists on the platform:
Algorithmic Playlists: These are the ones Spotify’s system builds for each listener, like Discover Weekly and Release Radar. They are fueled entirely by data—listening history, what similar fans are spinning, and other user behaviors.
Editorial Playlists: Curated by Spotify's own team of music experts, these are the heavy hitters—think RapCaviar or Today's Top Hits. Getting on these requires a direct pitch right from your Spotify for Artists dashboard.
User-Generated Playlists: These are built by everyday fans, independent curators, and influencers. Never underestimate their power. A spot on a popular user-created playlist can trigger the algorithm in a big way.
Speaking the Algorithm's Language
No matter which type of playlist you're aiming for, the algorithm is always watching. It keeps an eye on specific engagement metrics to figure out if a song has real momentum. Your job is to create the kind of positive signals that prove your music is resonating.
The most critical metrics here are save rate, skip rate, and shares. A high save rate tells Spotify that listeners want to come back to your song. A low skip rate shows they aren't hitting "next" in the first 30 seconds. And when someone shares your track? That's the ultimate vote of confidence. These actions make your song simply irresistible to the system.
Pitching Your Music to Spotify Editors
When you have a new song ready to go, you get one chance to pitch it directly to Spotify's editorial team before it's released. You do this through the "Pitch a song" feature inside your Spotify for Artists account. To make it count, your pitch needs to be compelling and, most importantly, backed by data.
Don't just tell them your music is "unique." Use the data you have. Mention that your last track blew up in a specific city, or point out that your "Listeners also like" section shows you're a hit with fans of an artist already on their playlist. This gives them hard proof that an audience for your music is already waiting.
Spotify's global footprint is enormous. Its success in major markets is built on tracking regional tastes with precision. For instance, 28% of its monthly active users are in Europe, with another 137 million in Latin America and 113 million in North America. When you highlight strong regional data in your pitch, you're showing editors you know exactly where your music fits into this global puzzle. You can dig into more of these fascinating numbers on Spotify’s global listener breakdown on Analyzify.
Proving Your Track Has Momentum
Once your track is live, the real work begins. You need to keep analyzing its performance to show it's gaining traction. Check your "Source of Streams" data to see which playlists are sending you the most plays. If you land a placement, watch your daily listener and follower counts like a hawk.
A sudden spike in these numbers right after a playlist add is the exact kind of momentum you can bring up in future pitches or when you're reaching out to independent curators. To really get a handle on this whole process, check out our in-depth guide with more tips on how to get on Spotify playlists and boost your reach.
Going Deeper: Advanced Tactics & Common Data Traps
Once you've got a handle on the basics, it's time to move past just watching the stream counter. Real, sustainable growth isn't about chasing daily spikes; it's about digging into the long-term trends and understanding why people are listening. This is where you find the signals that actually predict a lasting career.
One of the most revealing places to start is your Source of Streams. This dashboard tells you exactly how listeners are discovering your music. Are they finding you through your artist profile, digging through their own library, or stumbling upon you in a playlist?
While a healthy mix is always good, seeing a big chunk of your traffic from "Your profile and catalog" or "Listener's own playlists and library" is a massive win. It’s solid proof that you're not just getting passive plays—you're building a loyal fanbase that actively seeks you out.
This same level of detail is what makes your audience retention graph so powerful.
Pinpointing Exactly When You Lose Listeners
Every single one of your tracks comes with an audience retention graph, showing the precise moment people tune out. Don't just glance at the average percentage and move on. You need to zoom in on the timestamps.
See a consistent drop-off around the 45-second mark across multiple songs? That's a huge clue. Maybe your intros are dragging, or a certain sound you're using just isn't connecting with people.
Sudden Dips: A sharp, vertical drop often points to a jarring transition, an unexpected element, or a section that completely kills the energy.
Gradual Decline: If you see a slow, steady slope downwards, it might mean the track is missing a strong hook or a dynamic shift to pull listeners through to the end.
Think of this as direct feedback from a focus group of thousands. It's telling you exactly what works and what doesn't. Learning to translate these visual patterns into actionable musical ideas is a game-changer. You can dive deeper into turning raw numbers into clear insights with our guide to Spotify data visualization.
Common Data Interpretation Mistakes
So many artists get tripped up by the same data traps. The biggest mistake? Obsessing over the total stream count while completely ignoring the metrics that actually drive your career forward. A million streams from a lean-back, passive playlist might inflate your ego, but it's way less valuable than 50,000 streams from listeners who also hit "save."
The most powerful signals of a genuine fan connection are saves and playlist adds. These actions tell Spotify’s algorithm that your music is important—something worth remembering and recommending to others. A high save-to-stream ratio is a much stronger predictor of long-term success than a high stream count on its own.
Another common pitfall is misreading your follower growth. If you see streams going up but your follower count is flat, you have a conversion problem. People are hearing your music, but they aren't sticking around for more.
This is a clear sign to put some serious effort into your artist profile. Beef up your bio, use Canvas to create compelling short videos for your tracks, and build a brand that makes listeners feel like they need to hit "Follow" to see what you do next. Steer clear of these common errors, and you can focus your energy on what really matters: building a real, lasting career.
Alright, you've started digging into your Spotify for Artists dashboard, and the numbers are flowing in. But what do they really mean? As you get more familiar with the data, some practical questions will inevitably pop up.
Let's clear the air and tackle the most common questions artists have. My goal here is to help you move past the confusion so you can make smarter, more confident decisions for your music.
Answering Your Top Spotify Data Questions
You're not alone in wondering about these things. In fact, these are some of the most frequent questions I get from artists trying to make sense of it all.
How Often Does Spotify Update My Artist Data?
The big numbers—your streams, listeners, and followers—get a fresh update every day, usually around 3 PM EST. This gives you a pretty immediate look at your music's day-to-day performance.
But when it comes to the deeper audience insights, like demographic data for specific cities and countries, you'll need to be a bit more patient. That information can take a few days to fully refresh. My advice? Check your stats regularly, but base your big strategic moves on weekly and monthly trends. Don't get bogged down by the tiny daily ups and downs.
Can I See Which Specific User Playlists My Music Is On?
Yes, you absolutely can. And honestly, this is one of the most powerful and often overlooked features in your dashboard.
Here's how you find it:
Head to the 'Music' tab in Spotify for Artists.
Pick a specific song you want to investigate.
Click on its 'Playlists' sub-tab.
Just like that, Spotify will show you a list of the top user-made and algorithmic playlists that are sending the most streams to that track.
This isn't just a list to stroke your ego. It's a direct connection to your most dedicated supporters. Use this to find superfans and get a real feel for the vibe or context your listeners are placing your music in.
What Is a Good Save-to-Stream Ratio?
Spotify keeps its cards close to the chest and doesn't publish official benchmarks. But based on what we see in the industry, a save rate of 10% or higher is a fantastic signal to the algorithm.
This means for every 10 people who listen to your track for at least 30 seconds, at least one of them hits 'save' to add it to their library. It tells Spotify your song isn't just background noise; it's something people actively want to hear again. That kind of engagement can be a major factor in getting you onto bigger algorithmic playlists.
My Streams Are High but My Followers Are Low. What Does This Mean?
Ah, the classic scenario. This usually means one thing: your music is getting discovered, most likely through playlists, but you haven't yet convinced those listeners to stick around. High stream counts are great for getting your foot in the door, but low follower growth points to a missed opportunity to build a real, lasting fanbase.
So, how do you fix it? You need to give people a reason to hit that 'Follow' button. Turn your artist profile from a simple landing page into a hub for your music.
Keep your bio fresh with your latest story.
Use the Artist Pick feature to shine a spotlight on your new single.
Upload cool, eye-catching Canvas videos for your key tracks.
Make sure your tour or show dates are always current.
Ready to stop guessing and start growing? artist.tools provides the industry's most powerful suite of Spotify analytics, from bot detection to playlist research and AI-powered editorial pitching. Take control of your music career today by visiting artist.tools.
.png)
Great insights for independent artists. Data analytics is becoming just as important as making good music understanding your audience and playlist performance can really help artists grow smarter on Spotify