Mastering Music Industry Data Analytics
- Aug 18, 2025
- 20 min read
In the music world, gut feelings are giving way to data-driven certainty. Music industry data analytics is the art of turning raw numbers—every stream, share, and save—into a clear roadmap for an artist's career. It’s about converting that digital noise into strategies that actually work.
The New Rhythm of the Music Business
Imagine a sound engineer mixing a track. They don't just trust their ears; they use digital tools to see the sound, pinpointing which frequencies hit just right and which fall flat. Music analytics applies that exact same logic to an artist's entire career.
It's no longer enough to just drop great music and cross your fingers. The artists and labels winning today are the ones who are actively listening to what the data is telling them. This isn't about letting an algorithm write your next hit. It’s about using objective insights to back up your artistic intuition, giving you the "why" behind what your fans are doing.
From Guesswork to Growth
For decades, the industry ran on gatekeepers, radio spins, and physical sales—metrics that were slow, clunky, and often left you guessing. The digital revolution blew that wide open. Now, every single stream, playlist add, and social media mention is a data point.
When you collect and analyze these points, they paint an incredibly detailed picture of who your audience is and where you stand in the market. This shift puts power back into the hands of everyone, from indie artists in their bedrooms to A&R reps at major labels.
A sudden spike in streams from a specific city isn't just a weird blip on the radar; it's a signal. It tells you it might be time to:
Run targeted social media ads directly to fans in that area.
Route your next tour through that city to tap into that growing fanbase.
Hit up local artists or influencers for a collaboration to go even deeper.
Data allows artists to find their audience with pinpoint accuracy, rather than just shouting into the void. It’s the difference between navigating with a compass and navigating with a GPS—both get you going in the right direction, but one gives you a much clearer, more efficient path to your destination.
Why Data Analytics Is No Longer Optional
Let's be real: understanding this stuff is now a core skill for building a sustainable music career. The competition is insane. Over 100,000 new tracks are uploaded to services like Spotify every single day. A great song alone just won't cut through that kind of noise.
Analytics gives you the edge. It helps you make smarter, faster, and more effective decisions.
Throughout this guide, we'll dig into the metrics that actually matter, show you the best places to find actionable data, and walk through real-world examples. You'll learn how to turn numbers on a screen into a powerful strategy that gets your music heard and connects you with fans who will stick around. Welcome to the new rhythm of the music business.
Decoding the Data: What Metrics Truly Matter
Jumping into music analytics can feel like trying to read a foreign language. You’re hit with a wall of dashboards, charts, and numbers, and it’s way too easy to get mesmerized by "vanity metrics"—those big, flashy numbers that look great on paper but tell you almost nothing about your actual connection with fans. The real growth happens when you focus on the numbers that signal genuine interest and long-term loyalty.
Let's break down the essential vocabulary. The goal here is to look at a dashboard and see a story about your audience, not just a random list of stats. Getting a grip on what each metric actually means is the first step toward making smart, data-driven decisions that can build a career.
This image lays out the core pillars of music analytics, showing how Audience, Revenue, and Engagement data all work together to form a solid strategy.
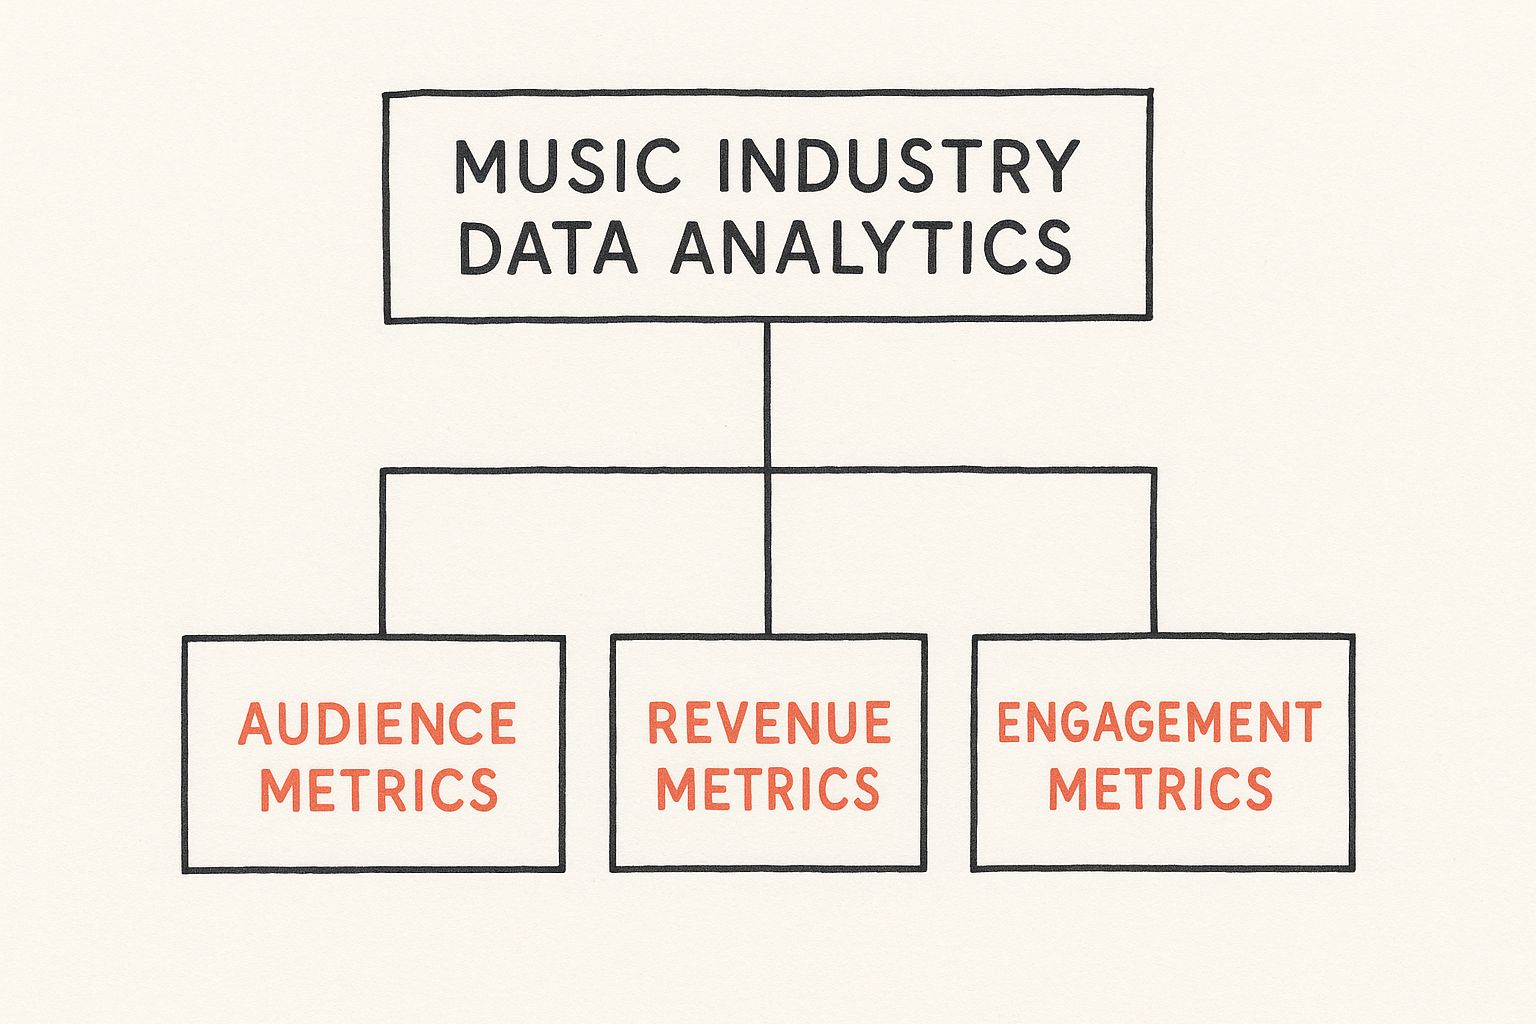
Think of it this way: a successful artist strategy needs a balanced diet. You have to understand who is listening, how that listening turns into income, and what actions fans are taking to show they’re invested.
To make sense of it all, it helps to break down the key metrics into digestible categories. The table below outlines some of the most important numbers you'll encounter, explaining what they measure and why they're so critical for your strategy.
Key Music Analytics Metrics and Their Meaning
Metric Category | Specific Metric | What It Measures | Strategic Importance |
|---|---|---|---|
Streaming & Consumption | Total Streams | The number of times a track is played for over 30 seconds. | Basic measure of reach and crucial for royalty calculations. |
Streaming & Consumption | Saves & Playlist Adds | When a listener actively saves a track to their library or adds it to a playlist. | Strong indicator of high listener intent and fan conversion. |
Streaming & Consumption | Save Rate | The percentage of listeners who save a track (Saves / Listeners). | A key algorithmic signal; high rates boost a track's visibility. |
Audience Demographics | Age & Gender | The age brackets and gender distribution of your listeners. | Informs your branding, messaging, and content style. |
Audience Demographics | Location (City/Country) | The geographical breakdown of where your streams are coming from. | Your roadmap for tour planning and targeted marketing campaigns. |
Audience Demographics | Source of Streams | How listeners discover your music (e.g., editorial playlists, personal library). | Reveals which discovery channels are working best for you. |
Engagement & Social | Social Shares | When a fan shares your music from a DSP to social media (e.g., Instagram Story). | Organic, word-of-mouth marketing that leverages fan networks. |
Engagement & Social | User-Generated Content (UGC) | Fans using your song in their own content (e.g., TikToks, Reels). | The ultimate form of engagement; drives exponential, viral reach. |
Engagement & Social | Follower Growth | The rate at which your follower count increases on DSPs and social platforms. | Measures your ability to convert casual listeners into a loyal fanbase. |
By keeping these metrics in mind, you can start to see the story behind the numbers and make decisions that truly move the needle.
Streaming and Consumption Metrics
At the very core of modern music analytics is streaming data. It's no secret that streaming has completely changed the game, now accounting for a staggering 84% of total music industry revenue. With over 600 million people worldwide paying for a streaming service, these platforms are ground zero for understanding how your music is being consumed. If you want to go deeper, these music streaming statistics paint a full picture of the market shift.
But here’s the thing: not all streams are created equal. A passive listen from someone who just let an algorithm take the wheel is worlds apart from an active, intentional play.
Streams: This is the most basic metric, counting every time your track gets played for at least 30 seconds. It’s essential for getting paid, but by itself, it doesn't give you much context about what the listener was thinking.
Saves & Playlist Adds: Now we're getting somewhere. A 'save' on a platform like Spotify is the modern equivalent of a fan walking into a record store and buying your album. An 'playlist add' means someone—a fan or a curator—thought your song fit a specific vibe or moment. Both are massive signals of high engagement.
Save Rate: This is calculated by dividing your saves by your listeners (Saves / Listeners). This little percentage is a huge signal to the algorithms. A high save rate tells Spotify that people who hear your song really connect with it, which dramatically increases the chances of it being pushed to new audiences.
Think of raw streams as people walking past a shop window. Some just glance, others might stop and look for a second. But a 'save' is someone walking inside, pulling out their wallet, and deciding to make your music a permanent part of their life. It’s a totally different level of commitment.
Audience Demographics and Location
Knowing who is listening is just as vital as knowing how much they're listening. Audience data helps you paint a clear picture of your core fan, which is pure gold for everything from marketing and tour routing to the kind of content you create.
Here are the key things to look for:
Age and Gender: Getting a handle on the main age groups and gender split of your audience helps you sharpen your messaging and visual identity.
Location (City/Country): This is basically your touring roadmap handed to you on a silver platter. A sudden listening spike in Minneapolis? That’s a direct signal telling you where your next show should be. It also makes your ad campaigns way more effective.
Source of Streams: This metric shows you how people found you. Was it from their personal library, a big editorial playlist, or one a friend made? This helps you figure out which channels are actually driving discovery.
Engagement and Social Metrics
Finally, engagement metrics show you how your music makes people act. These numbers track how your audience interacts with you and your music beyond just hitting play.
Social Shares: When a fan shares your track from Spotify to their Instagram story, they’re giving a personal recommendation to their entire network. It's organic, word-of-mouth marketing at its absolute best.
User-Generated Content (UGC): This is the holy grail of engagement. When fans start using your song in their TikToks or Instagram Reels, they’re weaving your art into their own lives. This exposes your music to countless new ears in a way that feels totally authentic.
Follower Growth: Simply tracking your follower count on streaming services and social media over time shows how well you’re converting casual listeners into a dedicated tribe.
By focusing on this mix of consumption, audience, and engagement data, you start to move past the surface-level noise. You begin to spot the patterns that reveal what's truly connecting with people, giving you a solid foundation for every single strategic move you make.
Where to Find Actionable Music Industry Data
Knowing which metrics matter is only half the battle. The other, arguably more important half, is knowing where to dig up the raw data in the first place. Actionable insights in music industry data analytics don't just materialize out of thin air; they’re pieced together from a variety of platforms, each offering a unique angle on your performance.
The real magic happens when you combine these sources. That’s how you build a complete, 360-degree view of an artist's career and see exactly where you stand in the competitive landscape. Your journey starts where the fans are—the platforms they use to listen to your music. From there, you branch out to get the bigger picture.
Native DSP Dashboards
Think of these as your home base. Getting familiar with platforms like Spotify for Artists, Apple Music for Artists, and the YouTube Studio is completely non-negotiable. They hand you direct, firsthand data on how your music is doing on their specific turf.
These native tools are gold because they offer granular details you just can't get anywhere else. You're looking at real-time stream counts, deep audience demographics, and the exact paths listeners are taking to discover your tracks.
Spotify for Artists: This is your go-to for a deep dive into who’s listening, how your tracks are performing on playlists (both editorial and algorithmic), and crucial metrics like save rates.
Apple Music for Artists: Offers priceless insight into your listeners inside the Apple ecosystem, including Shazams—a powerful signal of someone discovering your music "in the wild."
YouTube Studio: Essential for breaking down video performance, understanding how long people stick around on your music videos, and tracking how your content gets shared across the platform.
Social Media Analytics
Music doesn't exist in a bubble; it blows up in the social ecosystem. Platforms like TikTok, Instagram, and X (formerly Twitter) are the modern-day proving grounds where songs become cultural moments. Their built-in analytics tools are your window into how your music is fueling trends and connecting with people.
Think of social media data as the pulse of your audience's passion. A stream is a listen, but a fan using your song in their TikTok video is an active endorsement. It’s the difference between passive consumption and active participation.
For example, TikTok’s analytics can show you exactly how many videos have been created using your sound, giving you a direct read on its viral potential. Over on Instagram, you can track shares, saves, and engagement on your posts to see what kind of content actually gets your followers excited.
For a broader perspective on market trends, our guide on the top music streaming statistics you need to know in 2025 is also a great resource.
Third-Party Data Aggregators
While native platforms give you the close-up, third-party aggregators provide the wide-angle shot. Tools like Chartmetric, Soundcharts, and our very own artist.tools pull data from hundreds of different places—DSPs, social media, radio airplay, you name it—and crunch it all into a single, unified dashboard.
These platforms are absolutely vital for competitive analysis and understanding the market as a whole. They let you track not only your own progress but also see what other artists, playlists, and labels are doing. This is the context that turns your personal data points into genuine strategic intelligence, showing you exactly where you fit in the bigger picture.
The global recorded music industry keeps chugging along, reaching total revenues of $29.6 billion in 2024, a 4.8% jump from the previous year. You can discover more insights about the market's performance to get an even better handle on the landscape.
Putting Your Music Data into Action
Alright, so you’ve got a handle on the metrics and know where to find them. That’s the first step. Now for the fun part: connecting those dots and turning raw data into a real, career-building strategy. This is where music industry data analytics stops being about numbers on a screen and starts driving the decisions that can make or break an artist's career.
Think of your data as ingredients. On their own, they’re just raw materials. A little bit of this, a little bit of that. But when you combine them with a clear plan—a recipe—you can create something amazing. It’s the same with music data; isolated stats are interesting, but integrated insights lead to tangible growth.
Let's walk through a few practical scenarios to show you exactly how analytics can fuel smarter choices across the board. From discovering the next big thing to planning a sold-out tour, data is the roadmap.
Uncovering the Next Breakout Star
For A&R teams and talent scouts, the game has completely changed. Gut instinct will always be part of the equation, but data now acts as a powerful magnifying glass, helping them spot emerging artists long before they hit the mainstream. They aren't just listening for a great song anymore; they're looking for proof of a real, growing audience.
Scouts are glued to analytics platforms, monitoring key growth indicators that show an artist is gaining momentum organically.
Consistent Save Rate Growth: A track with a save rate that's climbing week after week is a huge signal. It tells them the song has serious staying power and is connecting deeply with listeners—it's not just a one-and-done listen.
High Follower-to-Listener Ratio: When a high percentage of people who listen to an artist also hit that "follow" button, it's a sign that the artist is building a dedicated fanbase, not just racking up passive plays.
UGC Velocity on TikTok: You can predict a song's viral potential way before it charts by tracking how quickly it’s being used in user-generated content. A sudden explosion of videos using a sound is a major red flag (in a good way).
By tracking these kinds of metrics, a label can find an artist who has already built a loyal community, making them a much less risky investment.
Precision-Targeted Marketing and Promotion
The days of casting a wide, expensive net and just hoping for the best are over. Thank goodness. With detailed audience demographics, marketing teams can now run campaigns with surgical precision, making sure every single dollar is spent reaching the people most likely to actually care about the music.
Imagine an indie pop artist looking at their Spotify for Artists dashboard. They discover a surprisingly large cluster of listeners aged 18-24 in Mexico City. This one piece of information can set off a whole chain of strategic moves.
Real-World Example: An indie artist saw a sudden, unexplained streaming spike in Mexico City. Instead of shrugging it off, they used this data to launch a targeted social media ad campaign aimed only at that city. The result? A massive jump in local followers, which they nurtured with tailored content, eventually leading them to sell out their first-ever international show there.
This hyper-targeted approach isn't just more cost-effective; it builds a much stronger bond with fans because you're meeting them where they are.
Mapping Out an Efficient Tour Route
Touring is still one of the biggest money-makers for artists, but it's also incredibly expensive. One poorly planned route can drain a bank account fast. This is where geographical streaming data becomes an absolute lifesaver for agents and managers.
Instead of guessing which cities might have the most fans, they can build an entire tour itinerary based on cold, hard evidence. By digging into listener data from Spotify, Apple Music, and YouTube, they can pinpoint the exact cities and regions with the highest density of dedicated fans.
This data-driven approach helps in a few key ways:
Maximize Ticket Sales: By prioritizing cities with proven listener hotspots, the chances of selling out venues go way, way up.
Optimize Travel Logistics: Grouping tour dates in geographically clustered regions cuts down on travel costs and, just as importantly, minimizes artist burnout.
Inform Venue Selection: The number of monthly listeners in a city helps you decide whether to book that 500-capacity club or go for the 2,000-seat theater. No more guesswork.
This kind of strategic thinking is happening industry-wide, especially as growth shifts globally. A MIDiA Research report noted that by 2024, the global paid subscriber base hit 818.3 million, with emerging markets driving most of that new growth. This shift, with China projected to become the second-largest market by 2032, shows exactly why location data is more critical than ever for planning a global strategy.
Crafting the Perfect Playlist Pitch
Landing on a major editorial playlist can be a career-making moment. We all know it. But playlist curators are drowning in thousands of submissions every single week. To cut through that noise, your pitch needs to prove your track is a perfect fit, and data is the most convincing proof you can offer.
When pitching a song, use your analytics to build a case that’s impossible to ignore.
Audience Overlap: Show the curator that your listeners' demographics (age, location, etc.) are a near-perfect match for the playlist's typical audience.
"Fans Also Like" Data: Use data from platforms like artist.tools to show that fans of artists already on the playlist are also listening to your music. It's a no-brainer for the curator.
Performance Metrics: Point to your song's strong save rates and high engagement to prove that it's already resonating with listeners. You're showing them it's a validated track.
When you arm yourself with this information, your pitch goes from a hopeful "please listen to my song" email to a data-backed business proposal. You’re not just saying your song is good; you’re proving it belongs.
Essential Tools for Music Data Analysis
Jumping into music data analytics can feel daunting, but having the right tools makes all the difference. Think of it like a producer needing a solid DAW; an artist or manager needs the right platforms to turn a sea of numbers into a clear, actionable game plan. These tools can be anything from the free dashboards you already have access to, all the way up to sophisticated platforms that pull everything together.
Your journey into data starts where your fans are already listening. These are your non-negotiables—the ground truth for how your music is really doing.
Foundational Native Dashboards
Every single artist, no matter their size, should be living in the native analytics dashboards offered by the major streaming platforms. This is your direct line to the source, giving you firsthand data you simply can't get anywhere else. It’s the most granular look you'll get into your audience's behavior.
Spotify for Artists: This is the absolute gold standard for understanding your audience on the world’s biggest streaming service. It gives you the nitty-gritty on listener demographics, real-time stream counts, and, most importantly, how your songs are performing on playlists. For a much deeper dive, our complete guide to **Spotify data analytics for modern artists** will help you master every feature.
Apple Music for Artists: This dashboard offers a clean, straightforward look at your performance inside the Apple ecosystem. One of its killer features is the Shazam data. It literally shows you where in the real world people are hearing your music and pulling out their phones to find out who you are—a super powerful signal of genuine, organic interest.
YouTube Studio: If you have any kind of visual presence, YouTube Studio is essential. It goes way beyond just view counts, showing you crucial metrics like audience retention (how long people actually watch), traffic sources, and subscriber growth. This is how you figure out what visual content is truly connecting and driving engagement.
These native tools are perfect for your day-to-day tracking. But to really see the full picture and understand where you fit in the broader music world, you need to zoom out.
Powerful Third-Party Aggregators
If native dashboards are like looking at your own backyard in high-definition, third-party aggregators give you a satellite view of the entire neighborhood. Platforms like Chartmetric and Soundcharts are mission-critical for competitive analysis, market research, and big-picture strategy. They hoover up data from hundreds of sources—DSPs, social media, radio airplay—and stitch it all together into a single, comprehensive dashboard.
This screenshot from Chartmetric, for instance, shows an artist's profile, neatly compiling everything from streaming numbers and social followers to playlist reach in one place.
This consolidated view is a lifesaver for managers and labels who need to quickly size up an artist's entire digital footprint and spot growth trends across multiple platforms at a glance.
With these kinds of tools, you can suddenly do things like:
Benchmark Your Growth: See how your streaming velocity and social media engagement stack up against artists in your lane. Are you growing faster or slower?
Spot Real Opportunities: Find out which playlists are actually breaking new tracks for your competitors and catch emerging trends before they blow up.
Get a 360-Degree View: Track an artist’s whole journey—from a sound going viral on TikTok to Spotify playlist adds and even radio spins—all in one spot.
An artist using only native dashboards is like a ship captain who can only see the waves directly in front of them. An aggregator is the radar system, showing every other ship in the sea, charting their courses, and revealing the weather patterns on the horizon.
Choosing the right tool really just comes down to your needs. A rising indie artist might get by perfectly fine with the free native dashboards. A manager juggling a roster of five artists, on the other hand, will find an aggregator like Chartmetric indispensable for staying on top of everything. And for a label A&R trying to make a high-stakes signing decision, these platforms are how they back up their gut feeling with cold, hard data, making sure every move is a calculated one.
Comparison of Music Analytics Tools
To help you decide what’s right for you, we’ve put together a quick comparison of some of the leading platforms. Think about your goals, your budget, and how deep you need to go with your data.
Tool | Best For | Key Features | Price Point |
|---|---|---|---|
Spotify for Artists | All artists on Spotify | Real-time stream counts, listener demographics, playlist tracking, audience engagement stats. | Free |
Apple Music for Artists | All artists on Apple Music | Streaming data, listener trends, Shazam discovery data, geographic insights. | Free |
Chartmetric | Managers, Labels, A&R, Publishers | Cross-platform analytics (Spotify, Apple, TikTok, etc.), competitive benchmarking, playlist monitoring, historical data. | Freemium, Paid plans from ~$140/mo |
Soundcharts | Labels, Publishers, Promoters | Comprehensive radio airplay data, social media monitoring, real-time charts, detailed artist & playlist data. | Paid plans from ~$100/mo |
artist.tools | Independent Artists, Managers | Spotify playlist data, contact info for curators, campaign management, stream tracking. | Paid plans from $25/mo |
Ultimately, the best tool is the one you'll actually use. Start with the free native dashboards to get your feet wet, and as your career grows and your needs become more complex, you can explore the powerful aggregator platforms to get that crucial competitive edge.
Building a Sustainable Data-Driven Strategy
Having access to powerful tools and endless data streams is one thing. Actually weaving them into a consistent, effective workflow is another beast entirely. A successful approach to music industry data analytics isn’t about occasional deep dives; it’s about building a sustainable habit that informs your decisions every single week.
This means you’ve got to move beyond vague goals like "get more streams" and start thinking like a tactician. The most effective strategies are built on specific, measurable, and time-bound goals.
For example, don't just aim high. Get specific. Instead of a fuzzy goal, set a clear target: “Increase playlist adds by 20% in the next quarter.” This gives you a real finish line and forces you to focus your promotional efforts on actions that will directly move that needle.
From Reactive Spikes to Proactive Trends
One of the biggest traps you can fall into is overreacting to short-term spikes. A sudden jump in streams feels amazing, but without context, it's just noise. A truly sustainable strategy is all about tracking metrics consistently over time to identify the trends that actually matter.
Think of it like tracking your fitness. Stepping on the scale once gives you a single number. But tracking your weight daily for three months reveals a pattern—a trend line that tells the real story of your progress. The same principle applies here.
Data informs your intuition; it doesn't replace it. The goal is to create a feedback loop where quantitative numbers are balanced with qualitative feedback, like fan comments and reviews. The numbers tell you what is happening, while the feedback tells you why.
By monitoring your data weekly, you can spot the early signs of a song catching fire in a new city or a decline in engagement on a specific social platform. This lets you make agile, informed decisions before a small trend becomes a major issue—or a missed opportunity.
Establishing a Weekly Data Check-in
To make this practical, create a simple weekly routine. Seriously, it doesn't need to be complicated. Just set aside 30 minutes every Monday to review a core set of metrics. This habit keeps you ahead of the curve and turns data analysis from a chore into a powerful strategic ritual.
Here’s a simple framework you can follow:
Review Core Streaming Metrics: Jump into your Spotify for Artists and Apple Music for Artists. How did your total streams, listeners, and saves change from last week?
Analyze Audience Growth: Check your follower growth on streaming platforms and key social media channels. Are you turning listeners into actual followers?
Identify Geographic Hotspots: Note any new cities or countries popping up in your top listener locations. Is there a new pocket of fans emerging somewhere?
Check Social Engagement: Which posts or content formats got the most interaction? Use that insight to shape your content plan for the coming week.
This consistent rhythm helps you build a deep, intuitive understanding of your audience and performance over time. It transforms data from a confusing jumble of numbers into a clear story that guides your career. For more actionable strategies, check out our guide on proven music business marketing tips to succeed.
Your Questions About Music Analytics, Answered
Jumping into music data can feel like learning a new language. It’s normal to have a ton of questions when you’re just starting out. We’ve rounded up some of the most common ones we hear from artists and their teams to give you clear, straight-up answers you can actually use.
How Much Data Do I Need Before Making a Move?
There’s no magic number here. The real key is to hunt for consistent trends, not just random, isolated spikes. A single great day on Spotify is awesome, but it's not a strategy. A steady week-over-week jump in listeners from Chicago? Now that’s a signal you can act on.
Get into the habit of tracking your data weekly. Once you see a clear pattern taking shape over a month or two—like a song's save rate steadily climbing—you've got a solid reason to make a strategic decision, like putting some marketing budget behind that track.
Do I Really Need Expensive Tools to Get Started?
Nope. Not at all. While the big-league platforms have some powerful features, you can get an incredible amount of mileage from the free dashboards you already have access to.
The best place for any artist to start is with Spotify for Artists and Apple Music for Artists. These tools are completely free and give you all the foundational data you need: who your audience is, where they are, and how your songs and playlists are performing. Get comfortable with these first before you even think about paying for a subscription.
How Often Should I Be Checking My Analytics?
Consistency beats frequency, every time. Checking your numbers every hour of every day is a recipe for anxiety and will only lead to reactive, panicked decisions.
A much healthier (and more effective) routine is a weekly check-in. Block out 30 minutes every Monday to review your core metrics. This gives you a rhythm. It’s frequent enough to catch important trends early and make smart adjustments, but it keeps you from getting lost in the meaningless daily ups and downs. This is how you focus on real, long-term growth.
Can Data Actually Predict a Hit Song?
Data can't look into a crystal ball and predict a hit with 100% certainty. But what it can do is identify songs that have hit potential way earlier than the old-school "gut feeling" method. Think of it as an early warning system for a track that’s really connecting with people.
So, what are the signs? Analysts are always on the lookout for a few key indicators:
High Save-to-Stream Ratios: This is huge. It means people aren't just listening; they're adding your song to their personal library. That’s a powerful sign of a track with staying power.
Strong Algorithmic Performance: If a song starts crushing it on algorithmic playlists like Discover Weekly, it’s a massive green light. It proves your music can hook brand new listeners all on its own.
Rapid UGC Adoption: When you see a sudden explosion of user-generated content on platforms like TikTok using your sound, that’s a clear signal that your song has the fuel for viral liftoff.
Ready to stop guessing and start making moves based on real data? [artist.tools](https://artist.tools) gives you the essential insights you need to truly understand your audience, find the right playlists, and build a career strategy that lasts. Check out our full suite of features and take control of your future at https://artist.tools.
.png)
.png)