Your Guide to Finding Spotify Stats All Time
- Jan 27
- 18 min read
Updated: May 15
TL;DR
Spotify only shows part of your story natively—this guide explains how to combine your Spotify for Artists dashboard, manual exports, and third-party tools to reconstruct your true all-time stats and turn them into a real growth strategy.
Spotify for Artists shows lifetime streams per track (since 2015) but caps most graphs at 28 days or 12 months—export data monthly to build your own archive.
Save total streams, monthly listeners, follower counts, and top cities/countries in a spreadsheet on the 1st of each month so you never lose historical context.
Third-party platforms like artist.tools automate daily snapshots and can surface historical monthly listeners, follower growth, and past playlist placements you missed.
Vet every playlist before pitching: check follower growth curves, listener-to-follower ratios, and bot indicators to keep your stats clean.
Watch for fake-stream red flags—extreme stream-to-listener ratios, unexpected geographies, and near-zero save rates often signal botted placements.
Use your strongest long-term cities to plan tours, geo-targeted ads, and local radio outreach instead of chasing one-year Wrapped highlights.
Pitch curators with hard data from past placements (saves, follower lifts) to make your story undeniable.
Royalty totals come from your distributor, not Spotify—use a royalty calculator on your all-time streams for a ballpark estimate only.
Every artist gets a kick out of Spotify Wrapped, but let's be real—it's a highlight reel, not the full picture. If you're serious about building a career, you need the whole story: your spotify stats all time. This isn't just about vanity metrics. It's about figuring out which songs actually have staying power, tracking how your audience has grown from day one, and knowing exactly where to put your energy next.
Beyond Wrapped: Uncovering Your True Spotify Stats
This guide—not a stats tool itself—walks artists through piecing together the complete history of their streaming performance. We’ll start with the official options inside Spotify for Artists, cover how to build your own historical archive, and then look at how third-party platforms like artist.tools can help reconstruct the entire arc of your musical journey. The goal is to give you a powerful, long-term perspective that a simple year-end summary just can't provide.
Getting this bigger picture is more crucial than ever. Spotify has ballooned into a global beast, hitting 696 million monthly active users (MAUs) in 2025—a massive 15.6% jump from 602 million in late 2023. While superstars like Taylor Swift are cruising past 100 billion total streams, the platform is also getting incredibly crowded. Think about it: 60,000 new tracks are dumped onto the platform every single day.
The result? A shocking 87% of all tracks on Spotify have fewer than 1,000 lifetime streams, turning the fight for visibility into an absolute grind. You can dive deeper into these compelling Spotify statistics if you're curious.
Why Lifetime Spotify Stats Matter for Artists
Relying on a single year's data from Wrapped is like trying to understand a movie by watching a 30-second trailer. It only gives you a fraction of the story. When you take the time to compile your all-time stats, you unlock a much deeper, more strategic view of your career.
Looking at the big picture helps you gain critical insights you'd otherwise miss:
Spot Your Real Evergreen Tracks: Find out which older songs keep connecting with new listeners, proving they have long-term appeal way beyond the initial release hype.
Measure Actual Career Growth: See the real evolution of your monthly listeners, followers, and stream velocity over several years, not just the last one.
Connect Your Actions to Results: Pinpoint which marketing campaigns, collaborations, or key playlist adds had a genuine, lasting impact on your growth.
Make Smarter Moves: Use your historical performance data to guide future release strategies, decide where to tour, and figure out where your promotional budget will have the most impact.
The table below breaks down exactly why this broader perspective is so valuable.
All-Time vs Annual Stats: A Quick Comparison
This quick comparison shows the difference in the insights you gain from Spotify Wrapped versus a comprehensive all-time data analysis.
Metric | Spotify Wrapped (Annual) | All-Time Stats (Comprehensive) |
|---|---|---|
Top Songs | Shows the most popular tracks this year. | Reveals which songs have the most streams overall, identifying true fan favorites and evergreen hits. |
Audience Growth | Highlights year-over-year listener growth. | Maps out your entire growth trajectory, showing peaks, plateaus, and the long-term trend. |
Listener Location | Displays top cities and countries from the past 12 months. | Identifies consistent, long-term fanbases, helping you plan tours and targeted marketing more effectively. |
Playlist Impact | May show top playlists for the current year. | Allows you to trace growth spikes back to specific playlist placements over your entire career. |
Strategic Value | Good for short-term social media content and a quick ego boost. | Essential for long-term career planning, financial forecasting, and understanding your music's legacy. |
Ultimately, looking at your all-time data is about making a fundamental shift in your thinking.
It’s about moving from a reactive mindset—chasing recent numbers—to a proactive strategy built on a complete understanding of your audience and your music's true legacy. This is the context you need to build a career that lasts.
How to See All-Time Spotify Stats in Spotify for Artists
Your journey to uncovering your all-time Spotify stats begins right where the music lives: your Spotify for Artists dashboard. Now, you won't find a big, shiny "All-Time Stats" button—Spotify doesn't make it quite that simple. But this is ground zero for the raw data you'll need to piece together your complete streaming story.
Quick orientation: if you’re an artist, your starting point is Spotify for Artists, where you can see total streams per track since 2015 plus rolling 28-day audience data. If you’re a listener looking at your own all-time listening history, Spotify for Artists won’t help—you’d need Spotify’s account data download or a third-party listener-stats service, which sit outside the scope of this artist-focused guide.
The biggest hurdle you'll face is that the platform is built for the here-and-now. Most of the detailed analytics default to a 28-day window, which is great for tracking a new release but not so helpful for seeing the big picture. To get that long-term view, you have to get into the habit of exporting your data and creating your own archive.
Finding and Exporting Your Analytics
Once you're logged into your dashboard, the "Music" and "Audience" tabs are your best friends. This is where you'll find the nitty-gritty details on your tracks, listeners, and playlists. The trick is to play around with the date range options for every metric you can.
Individual Track Streams: For any song you've released, you can see its total stream count since 2015. This is a great lifetime number for a specific track, but the day-by-day historical graph is often limited.
Audience Demographics: Head over to the "Audience" tab for the goods on your listeners' age, gender, and location. You can toggle the time frame here to see trends over the past week, month, or even the last year.
Playlist Placements: This section is pure gold. It shows you exactly which playlists are pushing streams your way. By exporting this info regularly, you can look back and see which placements delivered real, lasting impact versus just a quick spike.
To grab this data, keep an eye out for a download or export button, usually a small arrow icon, on the analytics pages. Clicking it will generate a CSV file—a basic spreadsheet that's perfect for building out your historical database.
The secret sauce here is simple discipline. I tell every artist I work with to set a recurring reminder on the first of every month. Log in, export your key stats, and file them away. It might feel tedious at first, but over time, this habit creates an incredibly valuable record of your career's trajectory.
This is how you turn scattered annual snapshots into a continuous, actionable overview of your growth.
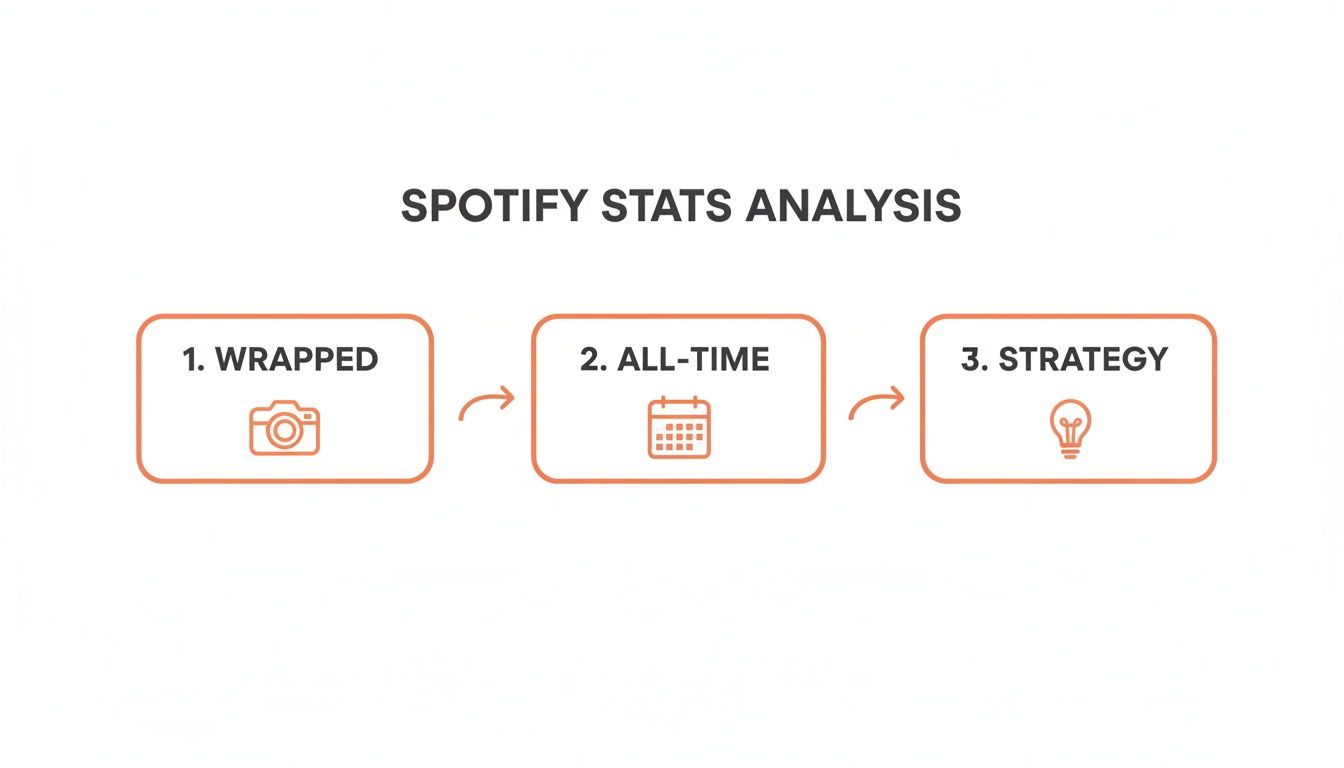
This flowchart nails the process. It's about moving beyond the flashy yearly recaps to build a solid, all-time dataset that truly informs your strategy moving forward.
Working Around the Limitations
The main drawback of the official dashboard is its focus on the present. Spotify prioritizes what’s happening right now, which means if you don't save your historical performance data, it can be gone for good. A perfect example is your monthly listener count; it's a rolling 28-day number. You can't just go into the dashboard and see what it was on June 15th two years ago.
This is precisely why building your own archive is non-negotiable.
Ready to start? Here’s a quick-and-dirty process:
Pick Your Metrics: Don't overwhelm yourself. Start with the data that really moves the needle: total streams per track, monthly listeners, follower count, and your top listener cities or countries.
Set Up a Master Sheet: Fire up Google Sheets or Excel. Create columns for each metric you chose and a new row for each date you log the data (e.g., the first of the month).
Download and Log: Make it a routine. Download the CSV files from Spotify for Artists and plug the key numbers into your master spreadsheet.
By doing this, you’re not just hoarding numbers. You're crafting a narrative of your growth—one that you own and can analyze whenever you want. To really squeeze every drop of value from the platform, check out our guide on the 7 essential tools within Spotify for Artists. This groundwork is the first real step in turning a bunch of data points into a powerful roadmap for your career.
Reconstructing Your Lifetime Spotify Stats with Third-Party Tools
Manually wrestling with spreadsheets from Spotify for Artists is a decent first step, but let's be honest—it's a grind. It’s tedious, you’re bound to make mistakes, and you always end up with frustrating gaps in your data. This is exactly where specialized platforms like artist.tools completely change the game for anyone serious about understanding their spotify stats all time.
A quick caveat on third-party tools: connecting any external platform to your Spotify account means granting data access, so review what each tool requests, what it stores, and its privacy policy before you sign in. Treat third-party numbers as a useful complement to—not a replacement for—your official Spotify for Artists data and your distributor’s royalty reports.
Instead of you having to remember to pull data, these tools work for you in the background. They're built to automatically grab daily snapshots of all the important metrics: track streams, monthly listeners, follower counts, you name it. This relentless, automated tracking is what builds the cohesive, long-term picture that Spotify’s own dashboard just can’t give you.
Visualizing Your Career Trajectory
The real magic of a dedicated platform is its ability to transform years of scattered data points into a clear, visual story. You can finally break free from the frustrating 28-day window and see your growth over months, or even years. This historical context is absolutely essential for making sense of your journey as an artist.
With the right tools, you can:
Pinpoint Key Moments: See the exact day a track started blowing up and connect it directly to that TikTok trend, a specific marketing campaign, or a crucial playlist add.
Understand Audience Fluctuations: Finally see the natural ebb and flow of your monthly listeners over the long haul. This helps you tell the difference between a temporary dip and a trend you need to worry about.
Measure Long-Term Follower Growth: Watch your follower count build as a steady, cumulative graph. This is a much better indicator of your true core fanbase than the much more volatile monthly listener metric.
This kind of historical data helps you answer the questions that really matter. Was that blog feature back in 2022 the real reason your single took off, or was it an undiscovered playlist add that happened a week later? Advanced tools help you connect those dots with confidence. For a deeper dive, our guide on how to track Spotify monthly listeners over time like a pro breaks down more specific strategies.
From Raw Data to Actionable Insights
Having a complete historical record is one thing; actually using it to make smarter decisions is what separates the pros from the amateurs. Advanced analytics platforms are brilliant at turning raw numbers into intelligence you can act on. They provide the missing context that helps you understand not just what happened, but why it happened.
For example, seeing a sudden spike in streams is great. But knowing that spike came from a user-curated playlist in Brazil gives you a tangible lead. You now know you have a budding audience in a specific region and can pour your marketing efforts there.
This is the level of detail that elevates your strategy. It’s about creating a feedback loop where your past performance directly informs your next move, making every release and every campaign more effective than the last.
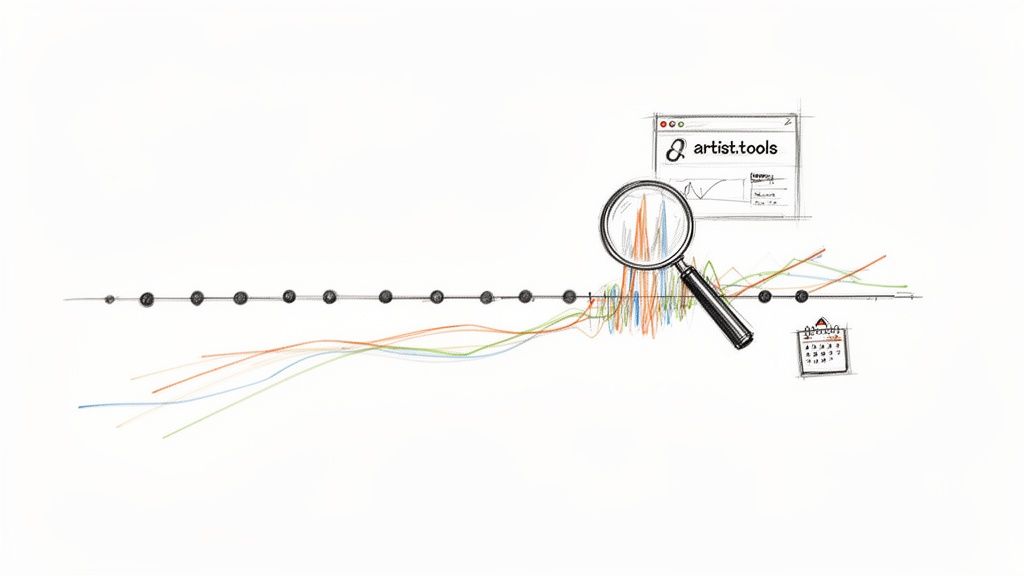
This kind of chart gives you an immediate visual of your follower growth against your monthly listeners over a long period. You can instantly spot periods of rapid growth and line them up against key release dates or promotional pushes.
Contextualizing Your Growth in the Broader Industry
Knowing your own numbers is critical, but seeing how they stack up against the wider music world provides some much-needed perspective. The streaming ecosystem is massive and incredibly competitive. Just look at Taylor Swift—she now reigns as Spotify's most-streamed artist ever, shattering records with an mind-boggling 118.2 billion total streams worldwide as of late 2025.
Her climb was insane, rocketing from 11.9 billion streams in 2020 to blasting past 100 billion by March 2025. This surge saw her overtake Drake—who hit his own massive milestones of 50 billion in 2022 and 70 billion in 2023—to finally claim the top spot in February 2024. With streaming now making up 69% of global recorded music sales, these aren't just stats; they are industry-shaking events. You can see more of the all-time most-streamed artists on ChartMasters.org.
While you might not be competing with superstars on that scale (yet!), understanding these macro trends is vital. The best tools often include features that let you benchmark your growth against other artists in your genre or at a similar stage in their career.
This comparative analysis is incredibly powerful. It helps you set realistic goals, see what's working for your peers, and understand where you have a competitive edge. It’s about moving from just looking at your own stats in a vacuum to having a strategic understanding of your place in the market.
Ultimately, using these tools is about working smarter, not harder. By automating all the tedious data collection and providing deep analytical features, platforms like artist.tools free you up to focus on what you're actually here to do: make incredible music and connect with the fans who are driving those numbers up.
How to Tell if Your Streaming Growth Is Real
Seeing a massive, sudden jump in your streams is an incredible feeling. But before you celebrate, you have to ask a tough question: is this growth actually real?
Inflated numbers from botted playlists can completely corrupt your spotify stats all time, get your music taken down, and do serious damage to your reputation. If you're trying to build a sustainable career, protecting the integrity of your analytics is non-negotiable.
This means learning how to spot the warning signs. When your numbers look too good to be true, they often are. Real, organic growth has a certain rhythm to it, while bot activity leaves a trail of strange, unnatural data patterns.
Spotting the Red Flags of Bot Activity
Figuring out if you've got fake streams takes a bit of detective work inside your Spotify for Artists dashboard. The whole game is looking for data that just doesn't make sense from a human behavior standpoint. Bots don't act like real fans, and the numbers they generate show it.
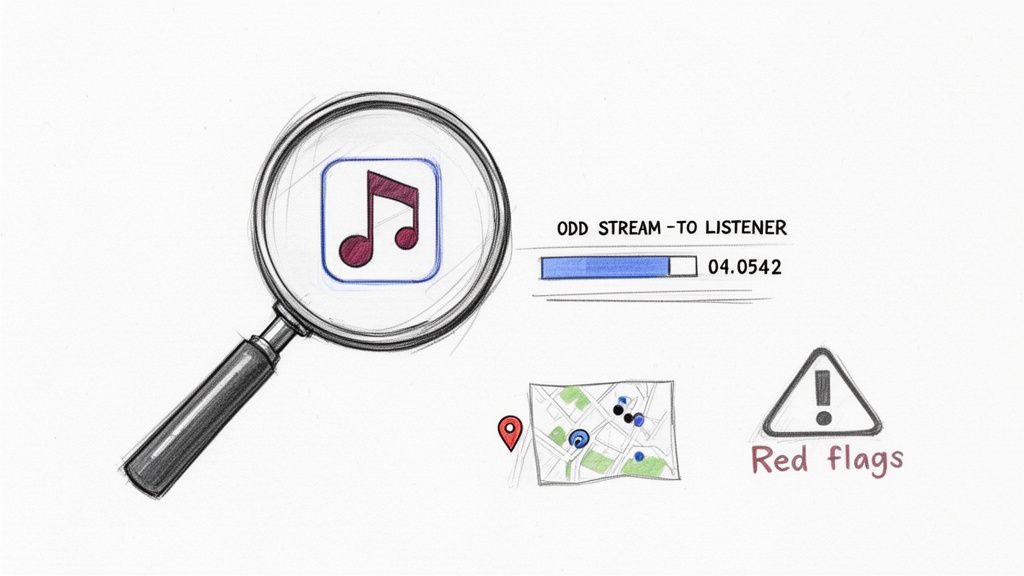
Keep an eye out for these classic red flags:
A Crazy Stream-to-Listener Ratio: If a single track suddenly gets 100,000 streams from only 1,000 listeners, that's a huge warning sign. It implies each "listener" played your song 100 times, which is just not how new audiences behave.
Weird Listener Locations: Did your indie folk song just blow up in a country where that genre has no market and where you've done zero promotion? While anything's possible, a sudden, isolated spike from an unexpected region is a classic sign of a bot farm.
Zero Saves or Playlist Adds: Real people who love a song will often save it to their library or add it to one of their own playlists. If you see a massive stream increase but a 0% save rate, it’s a strong signal that no real human engagement is happening.
If you suspect something's off, it's vital to learn more about how to spot fake Spotify streams to protect your profile.
When your data tells a story that defies logic, trust your gut. A thousand real fans who save your music and share it with friends are infinitely more valuable than a million phantom streams from a server farm.
To help you get a clearer picture, here's a quick comparison of what healthy growth looks like versus what might be a bot-driven spike.
Red Flags of Bot Activity vs Healthy Growth
Indicator | Sign of Healthy Growth | Potential Red Flag for Bots |
|---|---|---|
Stream-to-Listener Ratio | A balanced ratio; e.g., 2,000 streams from 1,500 listeners. | An extremely high ratio; e.g., 50,000 streams from 500 listeners. |
Listener Location | Streams come from expected markets or regions where you've promoted. | A sudden, massive spike from a single, random city or country. |
Saves & Playlist Adds | A healthy percentage of listeners save the track or add it to their playlists. | Huge stream numbers with virtually zero saves or user playlist adds. |
Source of Streams | Growth comes from algorithmic playlists, user playlists, and your profile. | Almost 100% of new streams come from a single, obscure playlist. |
Follower Growth | A steady, gradual increase in followers over weeks and months. | An unnatural, vertical jump of thousands of followers in one day. |
Think of this table as a quick gut check. If your stats are leaning into the "Red Flag" column, it's time to investigate further.
Vetting Playlists Before You Even Think About Submitting
Most of the time, artificial stream problems come from one place: shady, low-quality playlists. Countless playlist "pluggers" promise huge numbers but deliver them through fraud. This is why vetting every single playlist before you submit your music is one of the most important habits you can build.
This is where a tool like the artist.tools Playlist Analyzer becomes absolutely essential. Instead of just guessing, you can pull up a playlist’s complete history and check its vital signs for legitimacy.
Imagine you're eyeing a playlist called "Indie Chill Vibes." Before you pitch, you should run it through an analyzer and look at its follower history. A healthy playlist shows gradual, organic growth over time. A botted playlist? It might show a sudden, vertical jump of 50,000 followers in a single day, followed by a flatline. That’s a massive red flag.
A Real-World Playlist Check
Let's walk through a quick scenario. You find a playlist that looks promising and use a tool to check its history. Here’s what you should be digging into:
Follower Growth: Does the graph show a steady, natural incline, or does it look like a skyscraper appeared overnight? Healthy growth is a gentle ski slope, not a brick wall.
Listener-to-Follower Ratio: A playlist with 100,000 followers but only a few hundred estimated daily listeners is a ghost town. It means the followers are likely fake accounts, not engaged fans waiting to hear new music.
Bot Detection Score: Platforms like artist.tools analyze a ton of data points to give you a bot score. A high score is a clear signal to stay away, no matter how tempting that follower count looks.
By making this vetting process a standard part of your promotion strategy, you ensure every placement you land contributes to real, meaningful growth. This disciplined approach is what keeps your all-time stats clean and reflective of genuine fan engagement—building a solid foundation you can actually count on.
Turning Your All-Time Stats into a Growth Strategy
Pulling together and verifying your spotify stats all time is a huge first step, but let's be real—the data itself is just a pile of numbers. Think of it as the history book of your career. Now it's time to use that history to write your future.
A smart growth strategy isn't about chasing random metrics. It's about turning what you've learned from your past performance into a concrete, actionable plan. This is where you stop just looking at numbers and start making them work for you. By digging into your long-term performance, you can figure out who your most dedicated listeners are, where you should tour next, and which marketing channels are actually worth your time and money.
Pinpoint Your True Superfans and Strongest Markets
Your all-time data is a treasure map leading straight to your most passionate listeners. While your Spotify for Artists dashboard is great for seeing top cities over the last month or year, your historical data uncovers the places that have stuck with you through thick and thin. These are your strongholds.
Imagine you notice that Austin, Texas, has been in your top five cities for three years running, even when you didn't have a new album out. That's not a fluke; that's a dedicated fanbase. This is a massive signal to:
Book a Show: Make Austin a non-negotiable stop on your next tour.
Target Your Ads: Run geo-targeted ads on social media for new music and merch, focusing specifically on your followers in and around Austin.
Get Local Airplay: Reach out to college and local radio stations in the area. Use your consistent listenership numbers as cold, hard proof of local demand.
This same logic applies to countries. If you see a sustained, multi-year presence in a place like Germany or Brazil, you've got a solid international foothold that's worth investing in.
Sharpen Your Playlist Pitching Strategy
Your past playlist placements are a goldmine. Seriously. Figuring out which playlists drove not just streams but actual saves and new followers tells you exactly what kind of curation clicks with your ideal audience. This historical context is your secret weapon for crafting pitches that curators can't ignore.
Let's say your data shows your last single blew up after being added to "Sad Indie Morning," a user-curated playlist with 30,000 followers. That tells you your music hits a nerve with listeners in a very specific mood and genre.
Don't just chase the big Spotify editorial playlists. Your history often shows that smaller, niche playlists are the ones that deliver truly engaged listeners who stick around. These are the placements that build a real career, one fan at a time.
Now, you can jump into a tool like the artist.tools Playlist Search and find dozens of other playlists with similar vibes, like "Rainy Day Folk" or "Coffee Shop Acoustics." This targeted approach beats blasting your music to every curator you can find, every single time.
Perfect Your Pitch with Hard Data
When you approach curators with historical data in hand, the entire conversation changes. You can move past generic "hope you like my new song" emails and use your past successes as compelling evidence.
Here’s how you can make your pitch undeniable:
Find the Right Curators: Use a powerful search function to filter playlists by genre, mood, and even keywords to find the perfect home for your new track.
Craft a Smarter Message: Use a tool like the artist.tools AI Editorial Pitch Generator. You can feed it details about your song, your marketing plans, and—this is the key—your past successes. The AI will help you weave a story that highlights why your new track is a no-brainer for their audience.
For instance, your pitch could say, "My last single was added to 'Sad Indie Morning' and saw a 40% increase in saves from its listeners, showing a strong connection with this exact vibe." That’s a powerful, data-backed statement that makes a curator sit up and pay attention.
By strategically using your all-time stats, you completely transform your approach to growth. You stop guessing what might work and start making decisions based on what has already worked. Every piece of historical data, from your most loyal cities to your most impactful playlist adds, becomes a building block for a smarter, more sustainable music career.
FAQ: All-Time and Lifetime Spotify Stats
Even with the best data in front of you, digging into your all-time Spotify stats can feel a bit confusing at first. As you shift from looking at simple yearly wrap-ups to a complete historical picture, some of the metrics and their quirks can throw you for a loop.
Let's clear up some of the most common questions artists ask when they start tracking their long-term performance. Getting these details right is the key to building a strategy that actually works.
Can Spotify for Artists Show My All-Time Streams for a Track?
Sort of, but not in the way you'd hope. Spotify for Artists doesn't give you a single, big "all-time" number for your entire catalog on the main dashboard. It does show you the total streams for each individual track since 2015.
That’s great for seeing how one song is doing, but the main analytics graphs are usually stuck on shorter timeframes, like the last 28 days or the past year. To get the true all-time story of your career—including things like historical monthly listeners—you either have to piece together data yourself over time or use a third-party tool that automatically tracks and stores it for you.
How Can I Find Out My Total Spotify Earnings?
Your official royalty statements will always come directly from your music distributor, whether that's DistroKid, TuneCore, or CD Baby. You won't find any financial data inside your Spotify for Artists account.
However, you can definitely put together a solid estimate to get a sense of your lifetime earnings. First, find your all-time stream count for every song and add them up. Then, plug that total into a tool like the artist.tools Spotify Royalties Calculator to get an estimated gross payout.
The calculation is based on average per-stream rates, which gives you a strong financial benchmark to work with.
Keep in mind, per-stream payout rates aren't fixed. They can change a lot based on the listener's country, their subscription type (Premium vs. Free), and your specific deal with your distributor. An estimator gives you a ballpark figure, not an official accounting statement.
This helps you connect the dots between your streaming numbers and potential revenue, which is absolutely vital for treating your music career like a business.
Why Did My Monthly Listeners Drop While My Streams Went Up?
This is probably one of the most common points of confusion for artists, but it's completely normal. The key is realizing these two metrics measure very different things.
Monthly Listeners: This is a rolling 28-day count of unique people who listened to your music. It’s all about your current audience reach.
All-Time Streams: This is a cumulative total that only goes up. Every single play gets added to this number and stays there forever.
So, your monthly listeners might dip if a big playlist feature ends, an ad campaign wraps up, or a seasonal song goes out of fashion. This just means fewer unique people are tuning in this month compared to last month.
Meanwhile, your core fans are still hitting play and new people are still discovering you, so your total stream count keeps climbing. It’s the perfect example of why you need to analyze both your short-term reach and your long-term growth.
Is It Possible to Recover Historical Stats I Never Tracked?
You're not completely out of luck. While you can't magically invent granular, day-by-day data from the past that was never saved, you can often recover a huge chunk of your history.
Platforms like artist.tools start tracking your profile's key metrics from the moment you’re added to the system.
Even better, tools like ours often have deep historical archives on millions of artists that go back long before you ever signed up. By looking up your profile, you can frequently access a surprising amount of your past performance, including:
Graphs of your historical monthly listeners
Your follower growth over time
Major playlist placements you might have totally missed
This allows you to piece together a large part of your career's story, filling in critical gaps and giving you the long-term context needed to understand your journey.
Ready to stop guessing and start building a real strategy with your data? artist.tools provides the most powerful suite of analytics to help you understand your all-time performance, vet playlists, and pitch your music with confidence. Get the insights you need to grow your career at https://artist.tools.